In this article we’re going to take a quick look at the Elliott Wave charts of $NQ_F, published in members area of the website. As our members know Nasdaq ended cycle from the 13740.55 high as 5 waves, and now in a recovery to correct this decline. According to Elliott wave theory, after a 5 waves impulsive decline, there should be a correction in 3 or 7 swings. In this article, we will look at some charts from members area and explain Elliott wave structure within the corrective bounce.
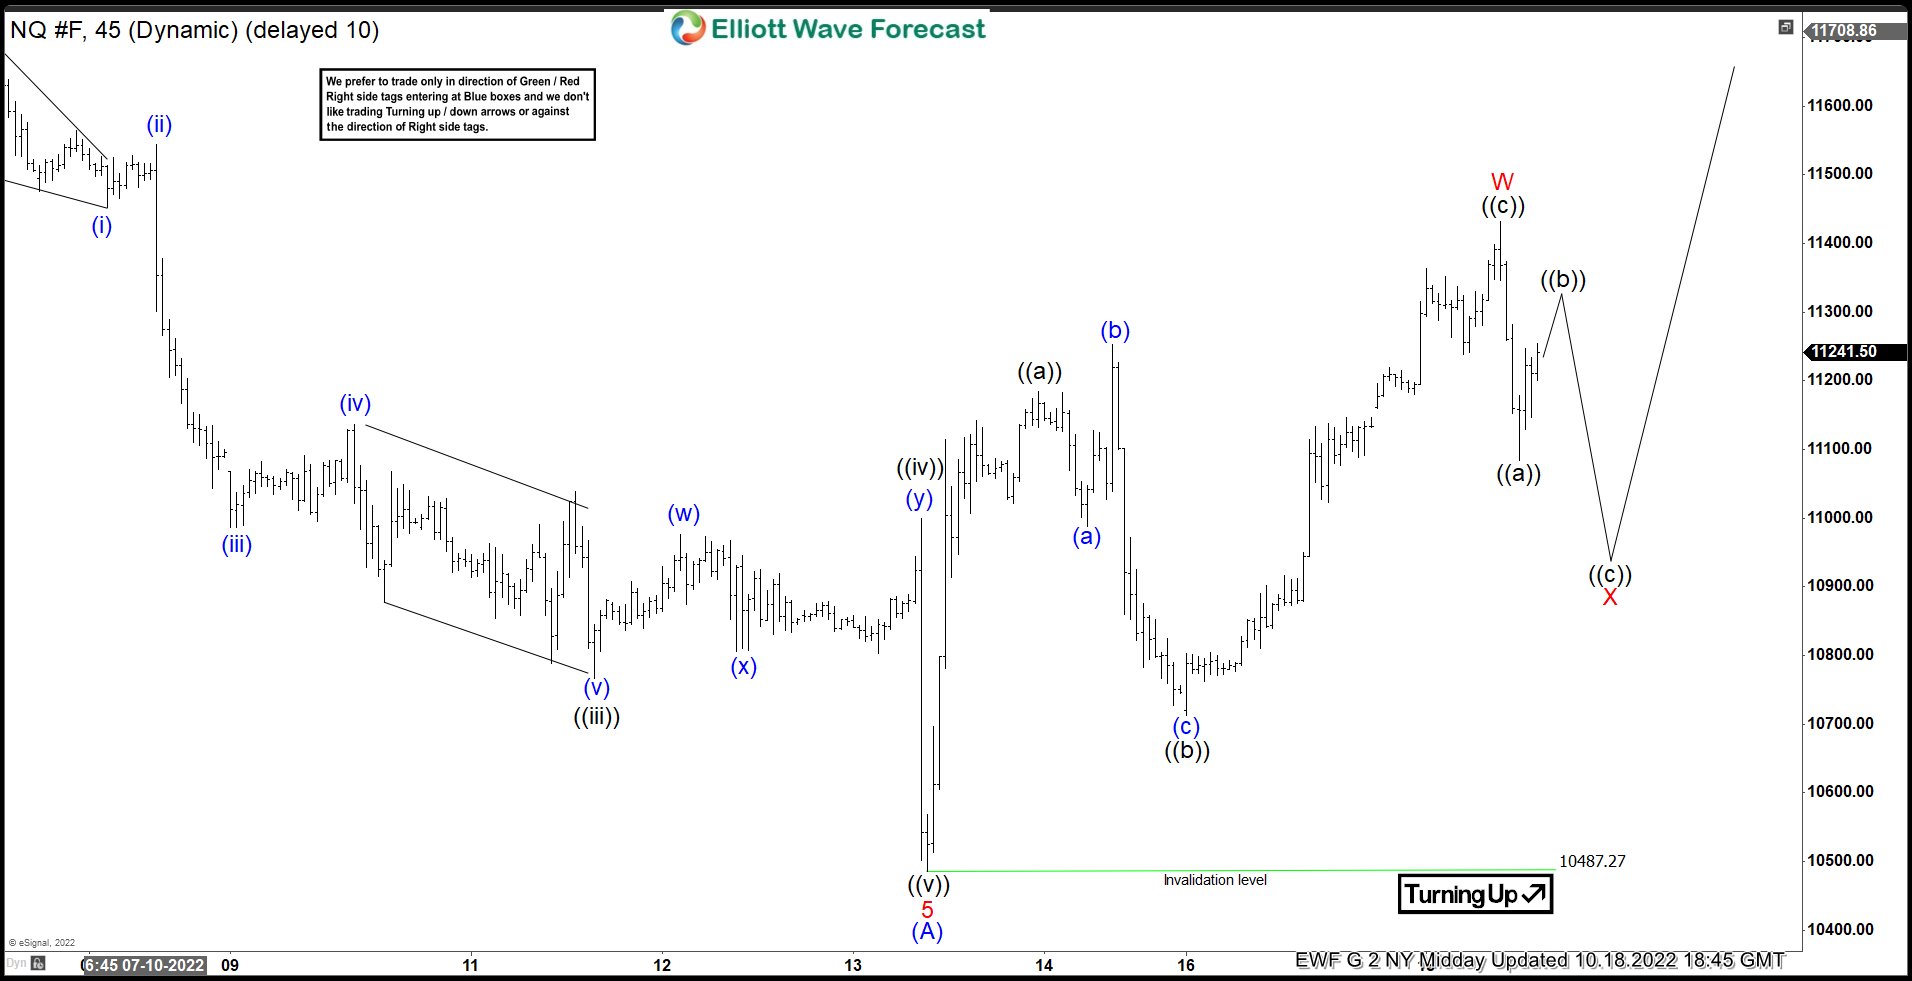
Nasdaq 1 Hour Elliott Wave Forecast October 18, 2022
In the chart below we can see Nasdaq completed a zigzag Elliott wave structure at 11431.75 on 10.18.2022 when wave ((a)) ended at 11185, wave ((b)) ended at 10713 and wave ((c)) ended at 11431.75. After this, we can see a drop which we have labelled as wave ((a)). As bounce fails below 11431.75 high, we expect another push lower to complete wave X before it turns higher in wave Y or bounces in 3 waves at least.
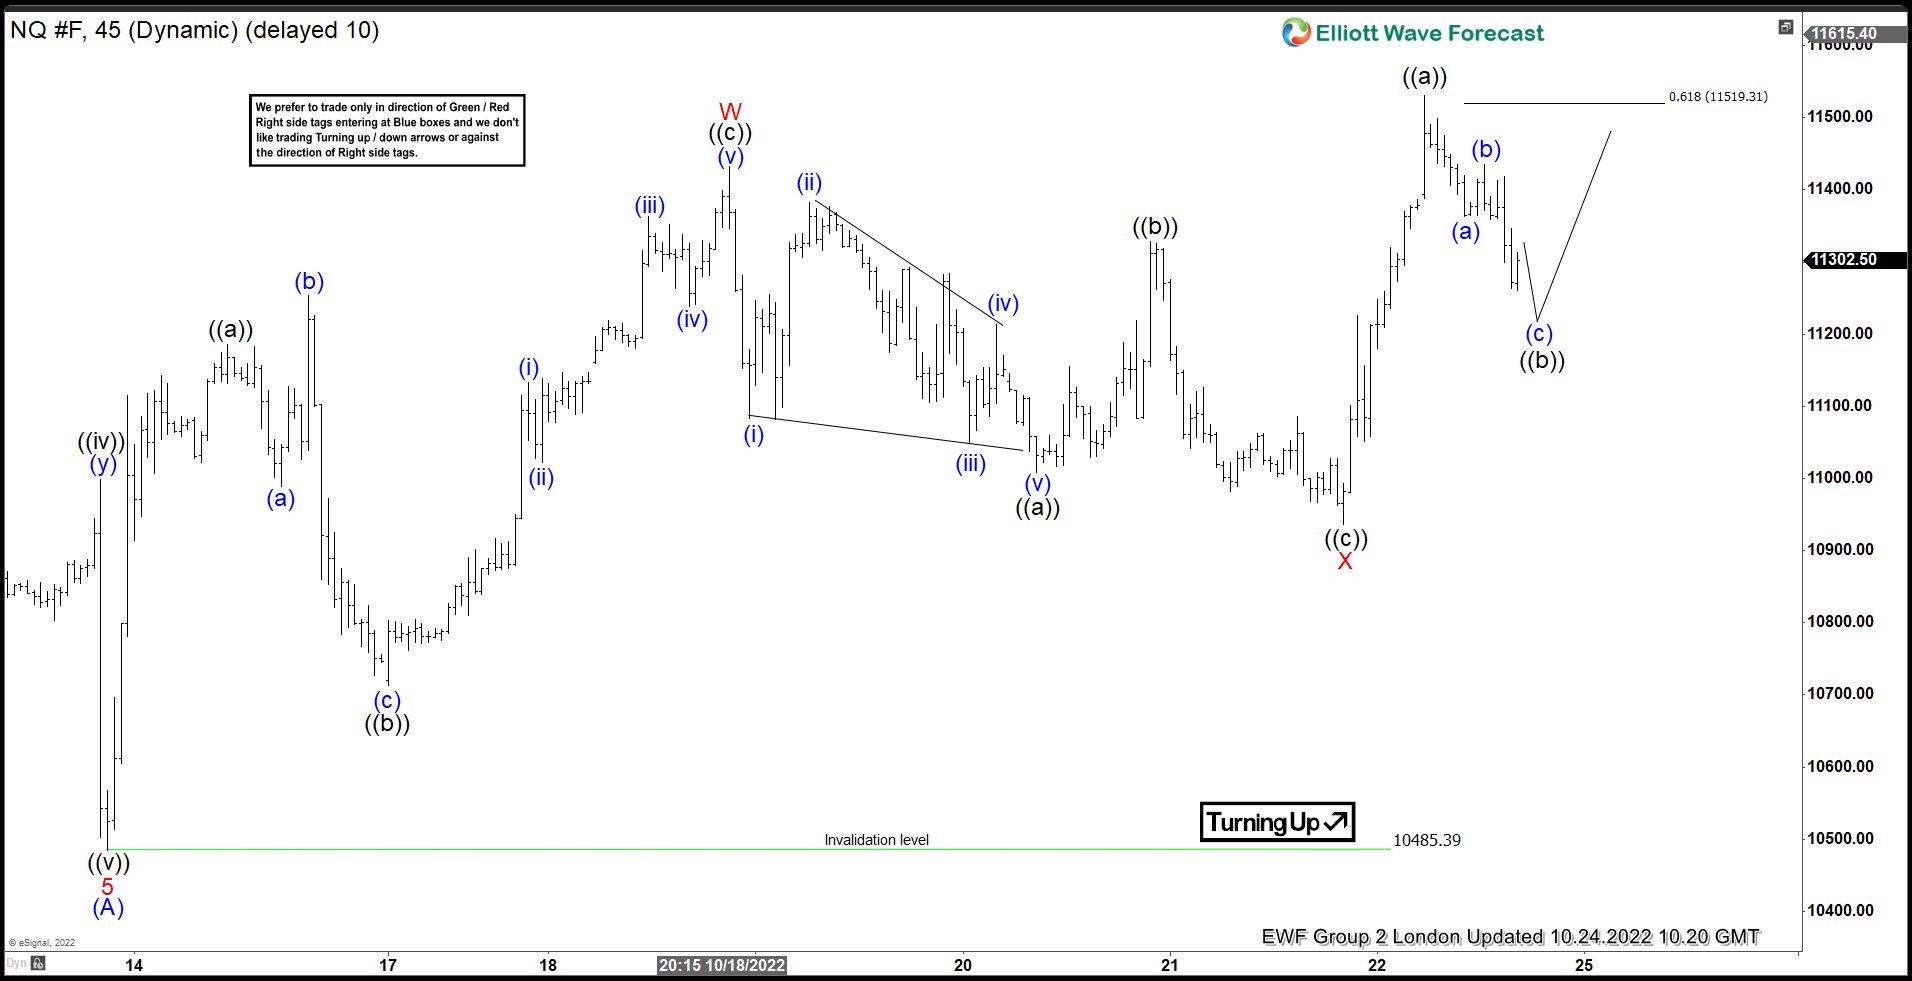
Nasdaq 1 Hour Elliott Wave Forecast October 23, 2022
In the chart below, we can see Nasdaq completed 3 waves pull back and is pushing higher again. Wave ((a)) took the form of a diagonal and completed at 11008, wave ((b) completed at 11328.75 and wave ((c)) of X completed at 10935.50. It already made a new high above red 10.18.2022 peak to create a short-term incomplete sequence against 10.21.2022 low. We expect wave ((b)) pull back to unfold in 3 or 7 swings and hold above 10.21.2022 low for extension higher to complete the sequence. Bear in mind, the chart shows wave ((b)) unfolding in 3 swings but while below ((a)) high, wave ((b)) can do 7 swings lower also.
Once seven swings up from 10.13.2022 low complete, expect the decline to resume for a new low below 10.13.2022 low or a larger 3 waves pull back at least to correct the cycle from 10.13.2022 low. Only a break of 10.21.2022 low would change this short-term view.
Back


