Liquidia Corporation, (LQDA) is a biopharmaceutical company. It develops, manufactures & commercializes various products for unmet patient needs in the United States. It comes under Healthcare sector in Biotechnology Industry & trades as “LQDA” ticker at Nasdaq.
As discussed in last article, it extends rally in impulse I from June-2025 low. It should extend into $38.16 – $40.90 area to finish the wave ((5)) as I before correction start. We like to buy the pullback in 3, 7 or 11 swings at extreme area, when reach.
LQDA – Elliott Wave Latest Weekly View: 
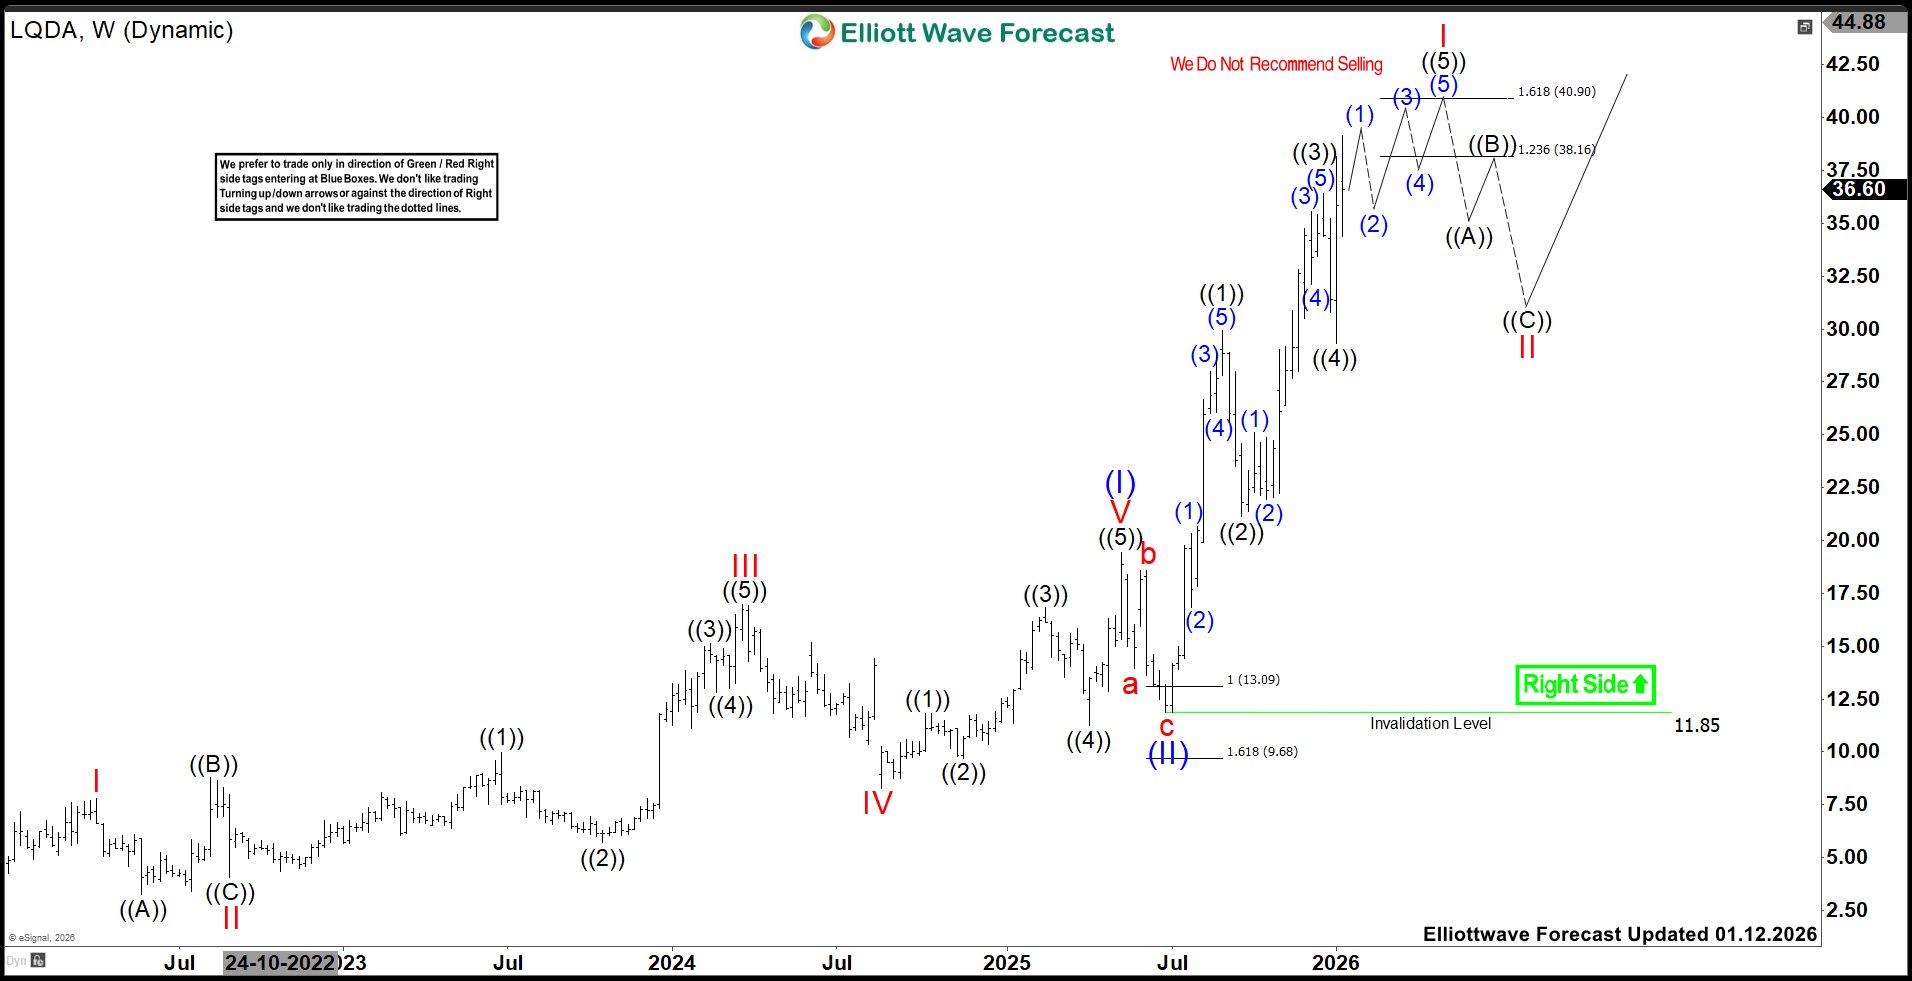
In weekly, it broke the previous ATH from October-2018 in last rally & confirms bullish bias. It favors rally in I of (III) against June-2025 low. From August-2021 low, it placed I of (I) at $7.78 high, II at $4.06 low, III at $16.99 high, IV at $8.26 low & V at $19.41 high in May-2025. It corrected lower in (II) in 3 swings, which ended at $11.85 low in June-2025 low. Above (II) low, it placed ((1)) of I at $29.94 high, ((2)) at $21.15 low, ((3)) at $36.41 high, ((4)) at $29.30 low & favors rally in ((5)).
LQDA – Elliott Wave View From 8.25.2025: 

Within ((1)), it ended (1) at $20.33 high, (2) at $16.82 low, (3) at $28.82 high (4) at $26.06 low & (5) at $29.94 high. Within ((3)), it placed (1) at $25.12 high, (2) at $21.94 low, (3) at $35.54 high, (4) at $32.11 low & (5) at $36.41 high. Currently, it favors rally in (1) of ((5)) & expect minor high before correcting in (2). As long as it stays above $29.30 low of 1.05.2026, it should extend higher in 5 swings to finish ((5)). The ((5)) expects to extend into $38.16 – $40.90 area to finish I impulse before correcting next. It already reached the minimum area, so if it breaks below $29.30 low, it can be II as alternate view. We like to buy the pullback in 3, 7 or 11 swings in II against June-2025 low. If it managed to erase the momentum divergence, then it can be nesting in I.
LQDA is not the part of regular service at EWF. But we provide time to time updates on instruments under blog section. Elliottwave Forecast updates 1-hour charts four times a day & 4-hour charts once a day for all our 78 instruments. We do a daily live session, where we guide our clients on the right side of the market. In addition, we have a chat room where our moderators will help you with any questions you have about what is happening in the market at the moment. You can try us for 14 days for only $0.99 (limited time offer). Also, you can check out the Educational section to learn Elliott wave theory & its application through different packages available & 1-1 coaching for doubts.
