JPMorgan Chase & Co. (JPM) is an American multinational investment bank and financial services holding company headquartered in New York City and incorporated in Delaware. As of December 31, 2021, JPMorgan Chase is the largest bank in the United States, the world’s largest bank by market capitalization, and the fifth-largest bank in the world in terms of total assets, with total assets totaling to US$3.831 trillion.
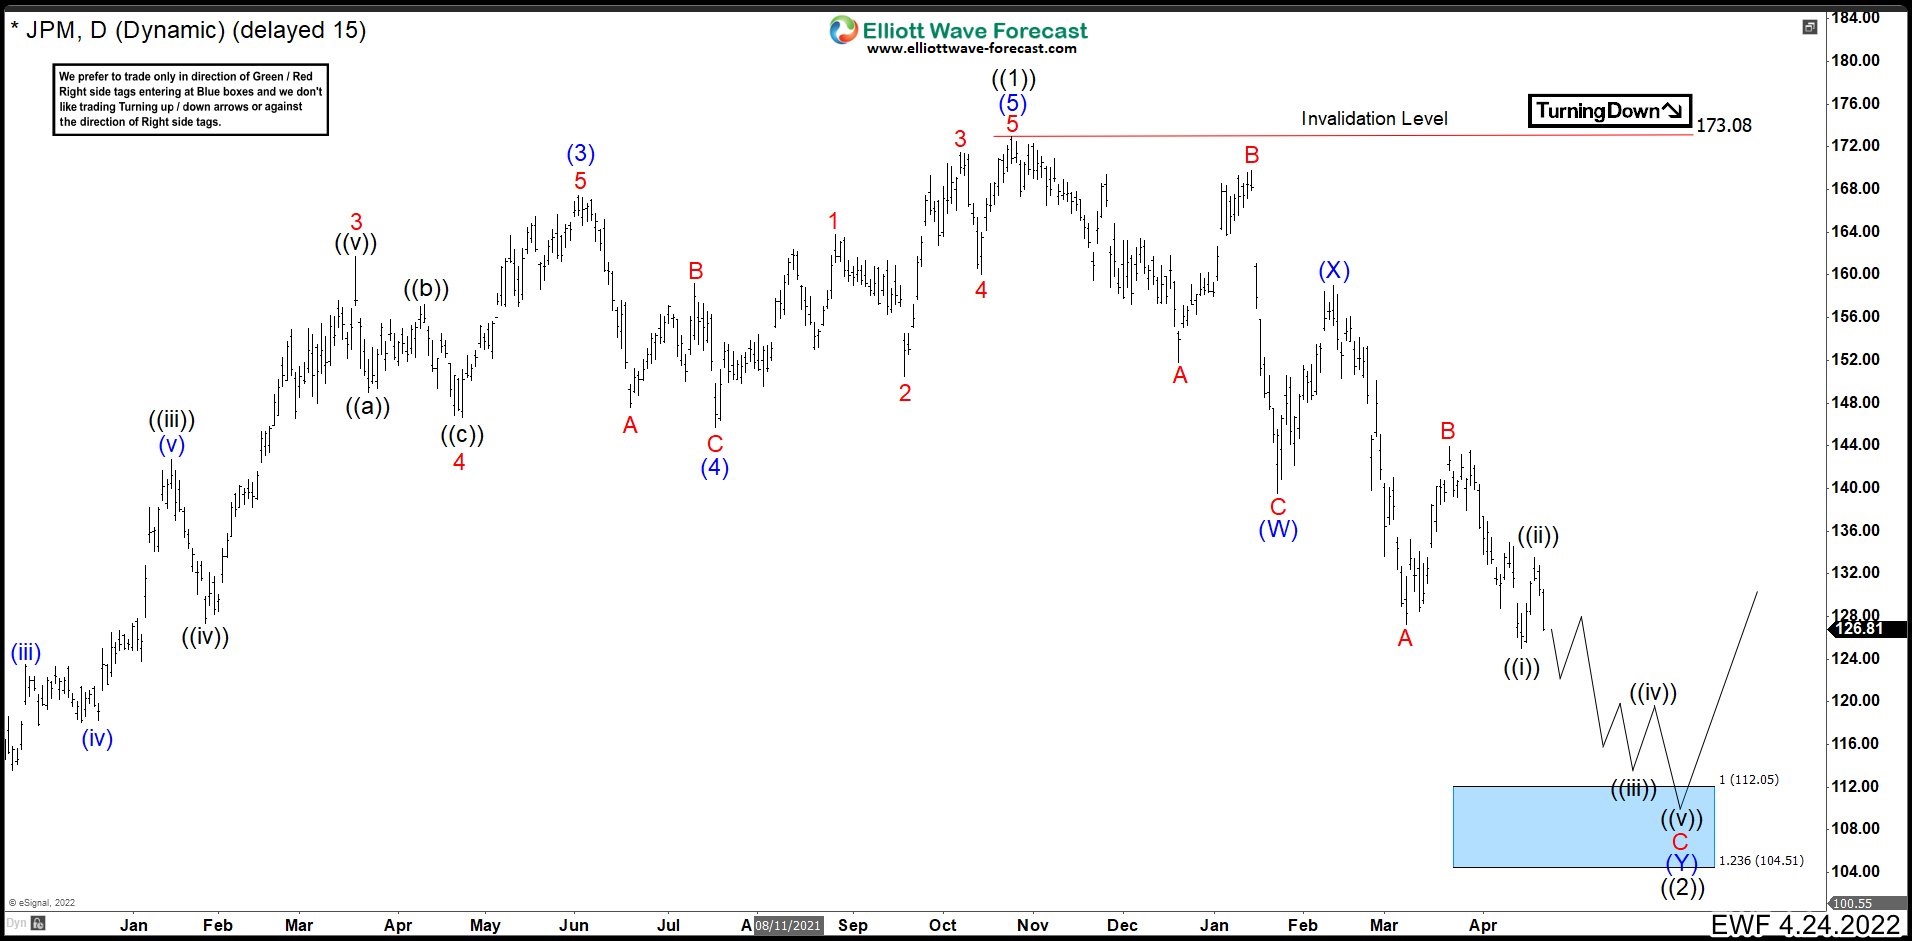
JPM Daily Chart April 2022
 This is the last update we did in JPMorgan (JPM) expecting a loss of more than 10%. The stock completed a market cycle at 172.96 on October 2021 from March 2020 low. From the peak, we called a double correction structure to fall 112.05 – 104.51 area before JPM rally. The market fell to the blue box at 106.06 and bounced (If you want to learn more about double correction or Elliott Wave Theory, follow these links: Elliott Wave Education and Elliott Wave Theory).
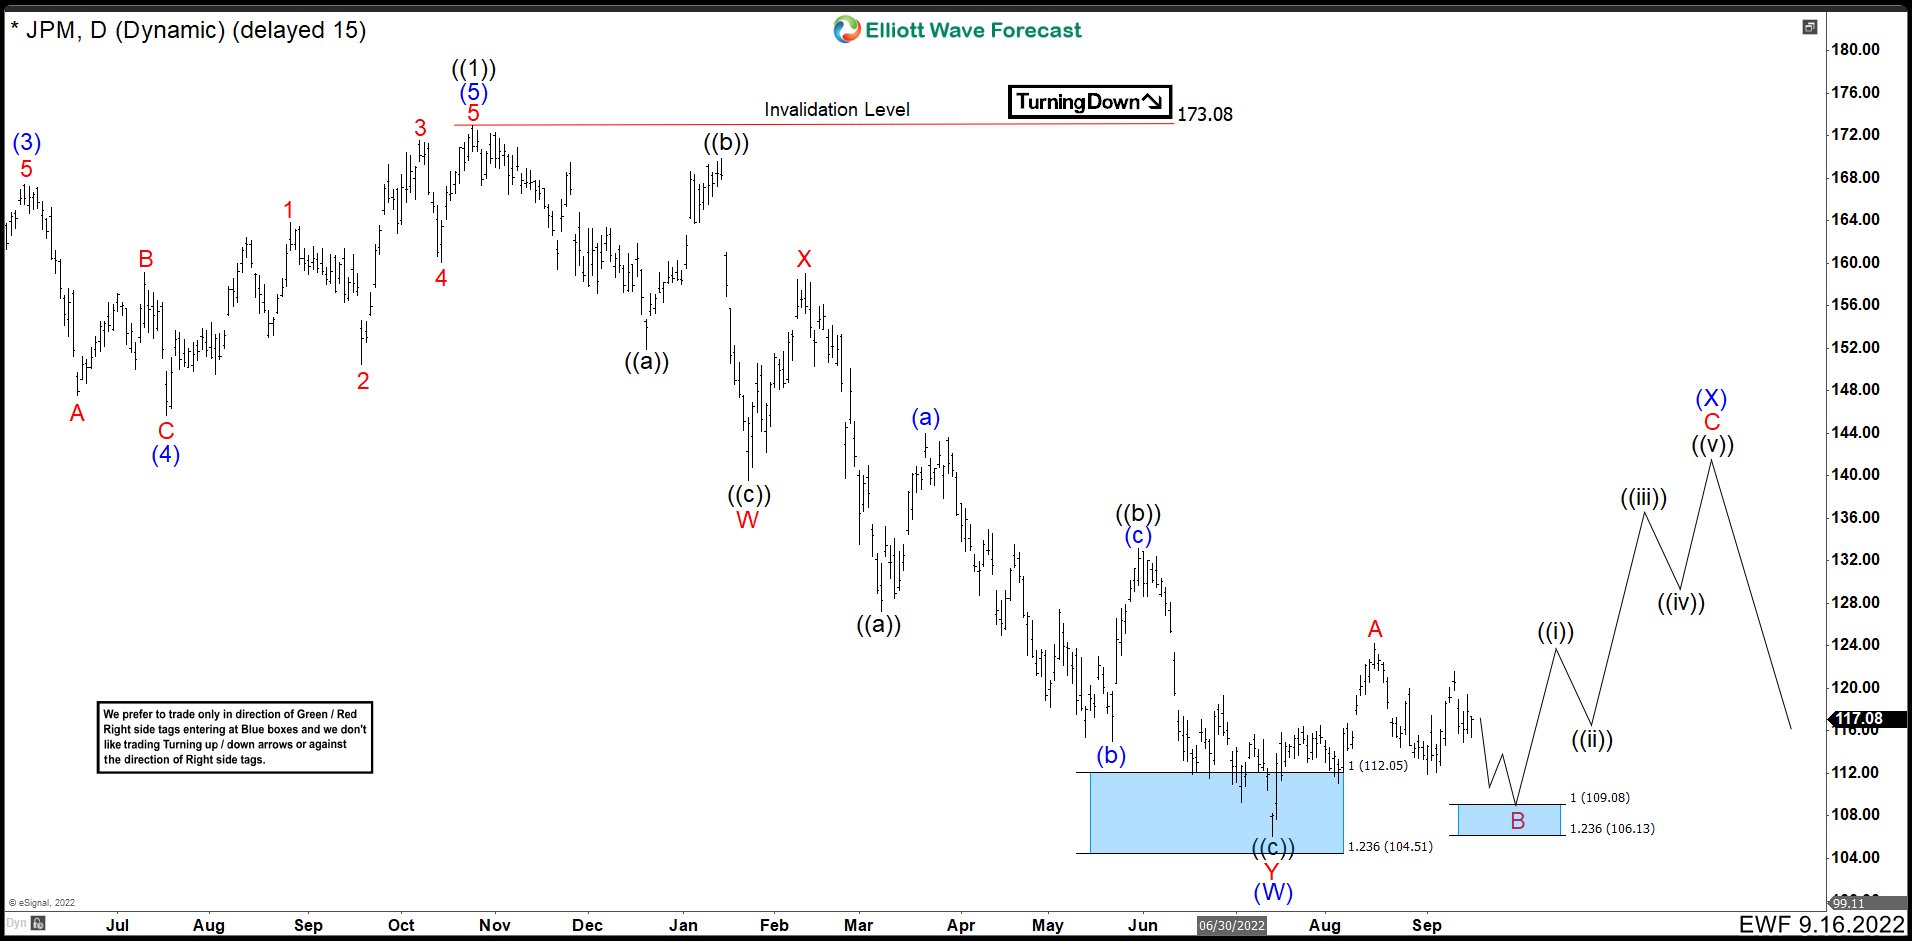
JPM Daily Chart September 2022
The rebound from the blue box looks corrective at the moment. This means that according to the Elliott Wave Principle, JPM should break the low of 106.06. For that, we must determine what structure is being built. In the chart above, we have a double correction from the 172.96 peak ending at 106.06 as wave (W). Therefore, we need a wave (X) before continuing lower and given the current structure we are building a flat 3-3-5 correction.
The first 3 waves ended wave A at 124.24 and we expect 3 corrective waves to fall towards the 109.08 – 106.13 area and bounce. This new rally should develop an impulse to end the flat correction before continuing lower.
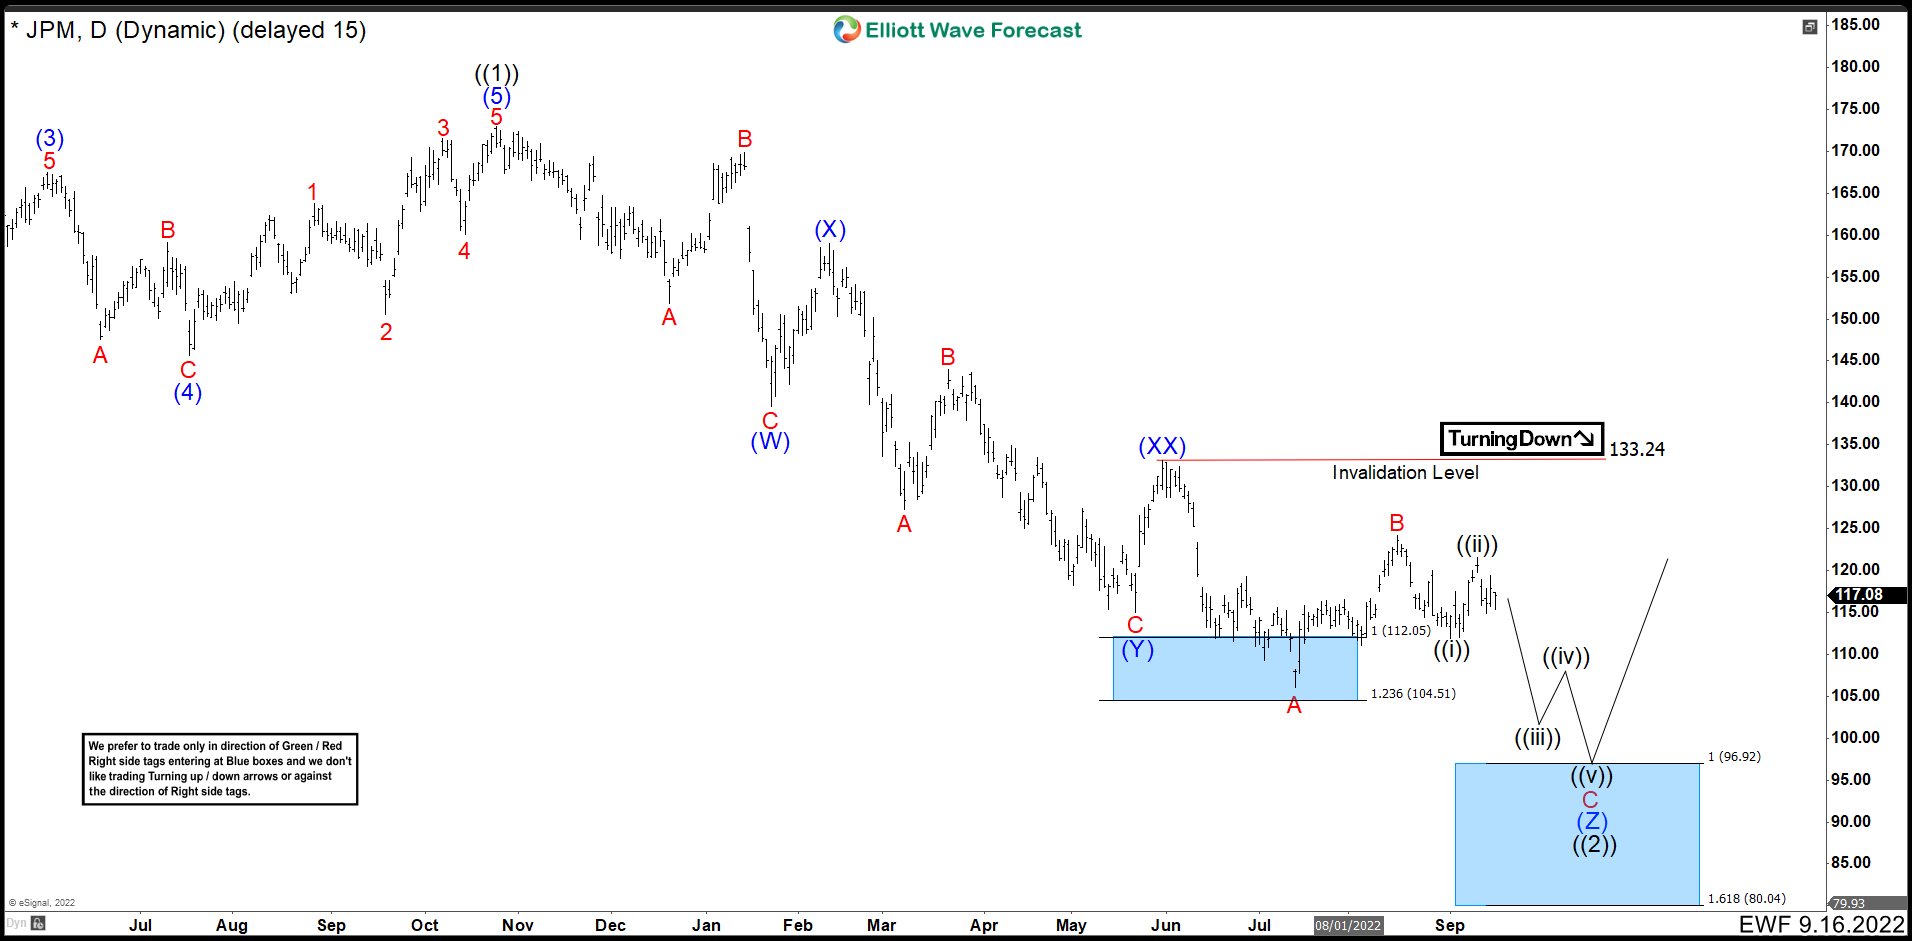
JPM Daily Chart September 2022 Alternative
The other option is that JPM builds a triple correction from 172.96 peak. The triple correction has a (W), (X), (Y), (XX), (Z) structure. Wave (XX) ended at 133.24 and from here we need 3 swings down to complete wave (Z) before continuing the move higher. Wave A of (Z) ended at 106.06 low. The 3 swings bounce ended at 124.24 as wave B. Now, we should see a move down towards 96.92 – 80.04 to complete wave C of (Z) and wave ((2)) before market continue with a rally.
Take 14 Days Trial
Elliottwave Forecast updates one-hour charts 4 times a day and 4-hour charts once a day for all our 78 instruments. We do a daily live session where we guide our clients on the right side of the market. In addition, we have a chat room where our moderators will help you with any questions you have about what is happening in the market.
Let’s trial 14 days for only $9.99 here: I want 14 days trial. Cancel Any time.
Back


