Hello Traders! In today’s article, we will look at the past performance of The Real Estate ETF ($IYR) and how we saw it trading lower since Sep 2022.
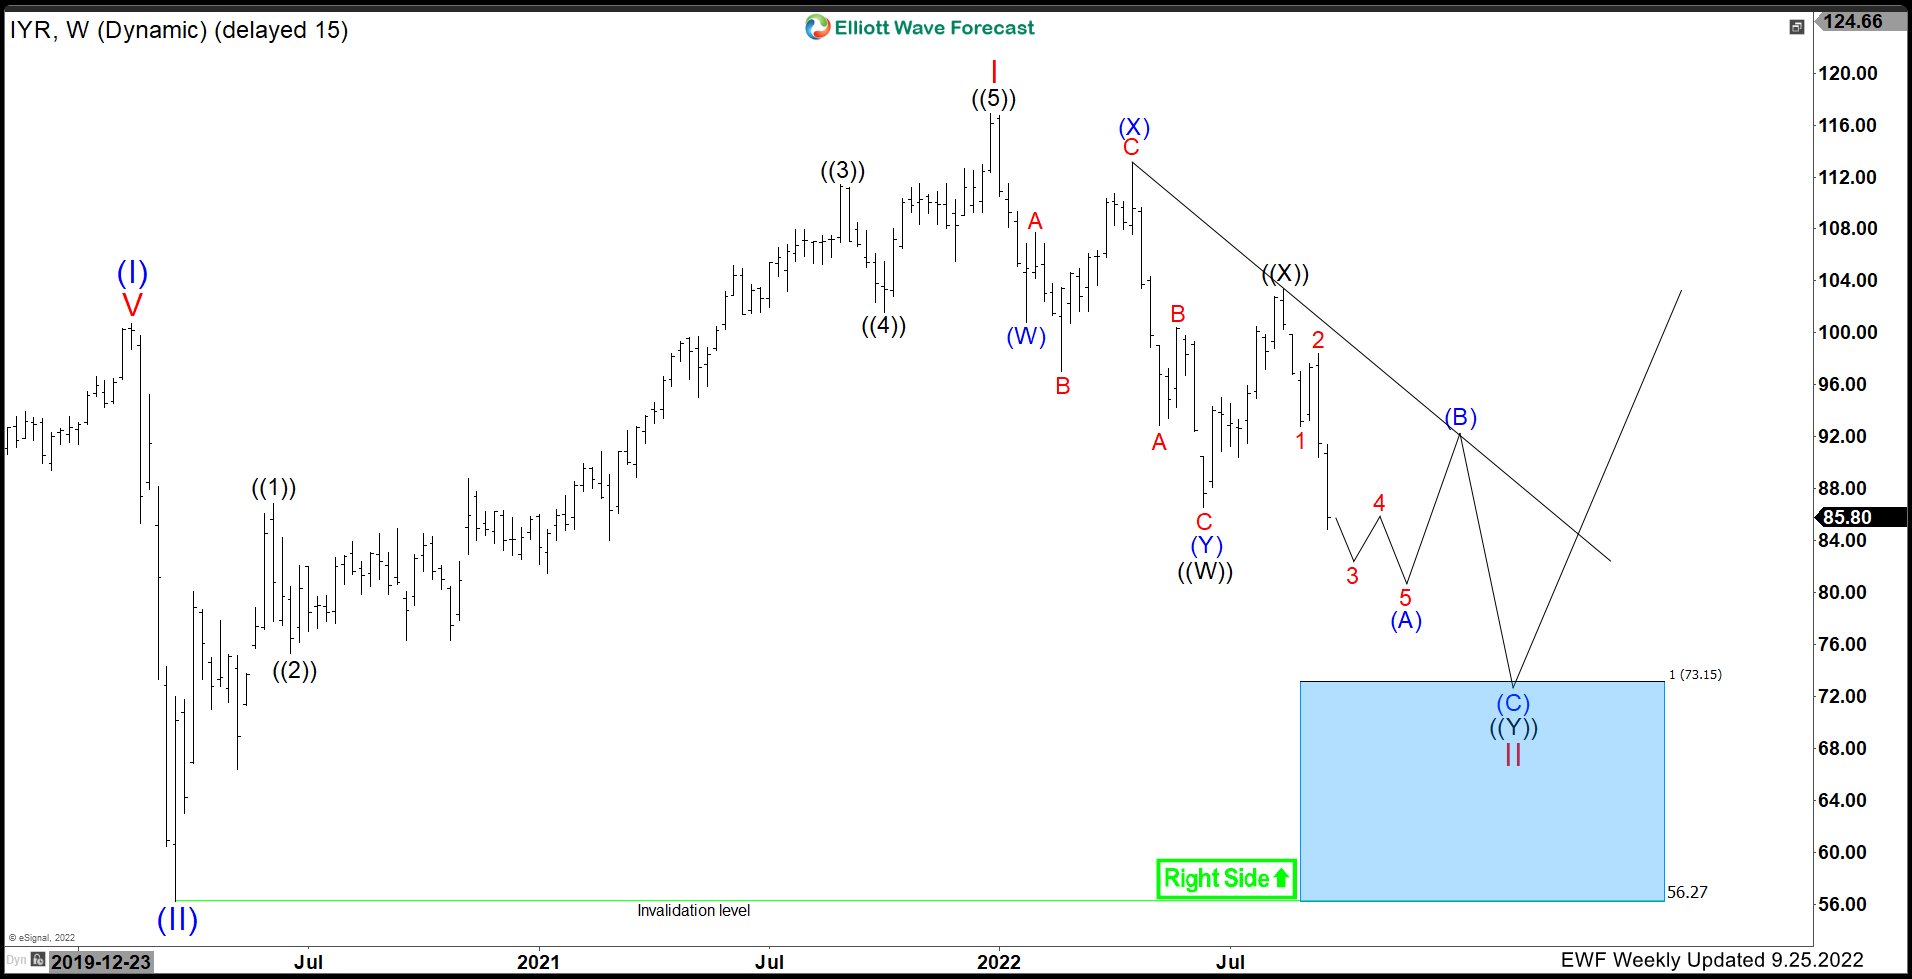
$IYR (Real Estate) Weekly Elliott Wave Analysis Sep 25th 2022:
In the initial article from September 2022, we expected the sell off in the sector to find a relief bounce in (B) and continue lower towards the Blue Box area. Lets take a look at the latest Elliott wave path that is unfolding.
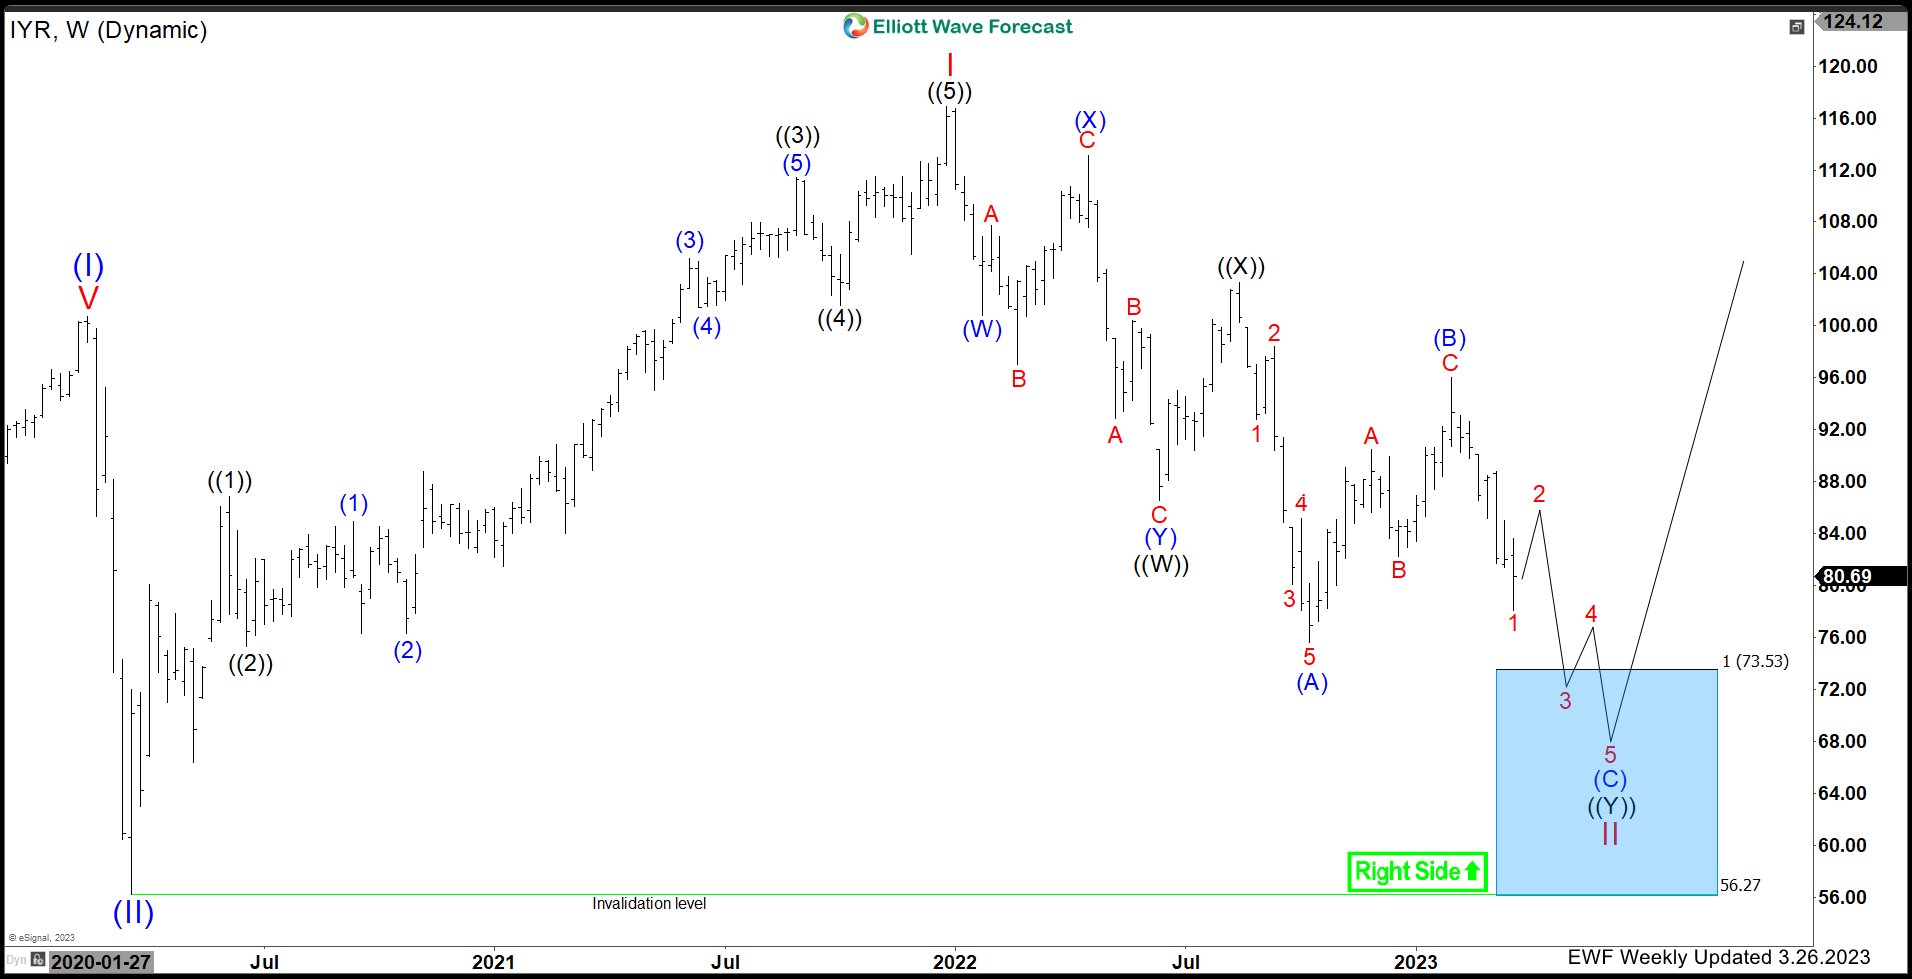
$IYR (Real Estate) Weekly Elliott Wave Analysis Mar 26th 2023:
As expected, the sell off unfolded in a 5 wave impulsive sequence in (A) which found buyers and bounced in a 3 swing (ABC) structure to reach the equal legs area at (B). The reaction from (B) in the shorter cycles is also showing 5 waves in red 1 with divergence. A bounce in red 2 should unfold but is expected to fail in 3 or 7 swings and continue lower towards the Blue Box area at 73.53 – 56.27.
There is a bullish sequence against March 2020 lows. We like to buy the dip in 7 swings at the blue box for a continuation to the upside as long as the March 2020 lows at $56.27 remains intact.
To conclude, we don’t believe in a crash but a correction is clearly unfolding and soon buyers will appear at the Blue Box area for a reaction higher. Once the reaction higher unfolds, we will be able to tell if the low is in place and continue higher or more downside will follow.
Elliott Wave Forecast
We cover 78 instruments in total, but not every chart is a trading recommendation. We present Official Trading Recommendations in the Live Trading Room. If not a member yet, Sign Up for Free 14 days Trial now and get access to new trading opportunities. Through time we have developed a respectable trading strategy which defines Entry, Stop Loss and Take Profit levels with high accuracy.
Welcome to Elliott Wave Forecast!
Back


