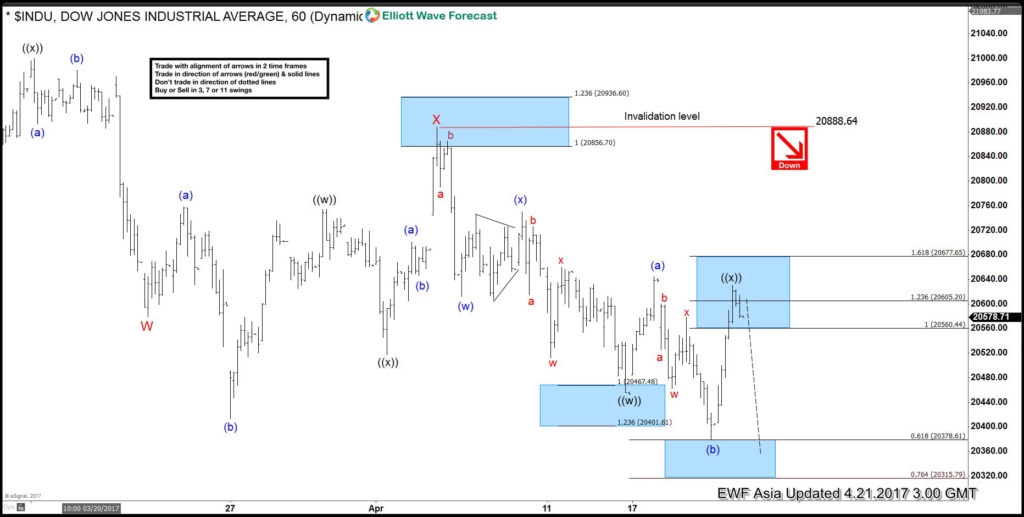
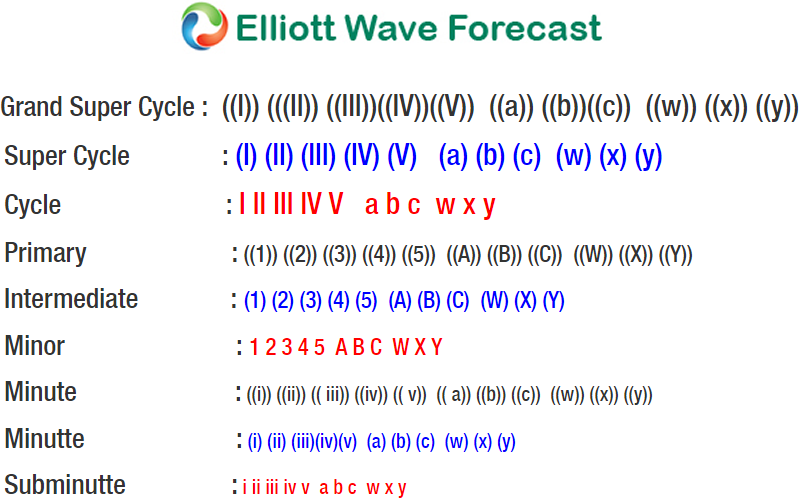
Short term Elliott Wave view in INDU ( Dow) suggest that instrument is showing 5 swings sequence from 3/03 peak (21018) favoring more downside. From 3/03 peak INDU is following a Double three Elliott wave Structure , where Minor wave W ended at 20579 low and Minor wave X ended at 20887 peak. Index has since broken below the 20412 low, suggesting the next leg lower in Minor wave Y has started already. The Internal Subdivision of Minor wave Y is also unfolding as Double three Elliott wave structure where Minute wave ((w)) ended at 20453 and Minute wave ((x)) bounce turns out to be a flat correction . Where the Minutte wave (a) ended at 20644 peak and Minutte wave (b) at 20379 low, above from there index could have ended the 5 waves in Minutte wave (c) of a flat within blue box area at yesterday’s peak 20629, while near term bounces fails below there & more importantly as far as pivot from 20888 peak Minute wave X connector’s peak stays intact index has scope to resume lower 1 more leg at least and can see 20129 – 19951 area where buyers should be waiting. We don’t like selling the index and expect to see buyers appearing in the above mentioned area for new highs or a larger 3 wave bounce at least.
INDU 1 Hour Elliott Wave Chart
 At Elliottwave-Forecast, we offer 24 hour coverage of 52 instruments from Monday – Friday using Elliott Wave Theory as primary tools of analysis. We provide Elliott Wave chart in 4 different time frames, up to 4 times a day update in 1 hour chart, two live sessions by our expert analysts, 24 hour chat room moderated by our expert analysts, market overview, and much more! With our expert team at your side to provide you with all the timely and accurate analysis, you will never be left in the dark and you can concentrate more on the actual trading and making profits. Check out our 14 day Trial to sample everything we have to offer.


