The Indices larger pullback from the highs is purely technical despite whatever fundamental or reason the news suggests. I will show the technical reasoning in this article. We will look at the Nikkei, FTSE, as well as the Hang Seng indices cycles up from the 2009 and 2008 lows. Each of these indices are shown progressively in the order mentioned on down this page.
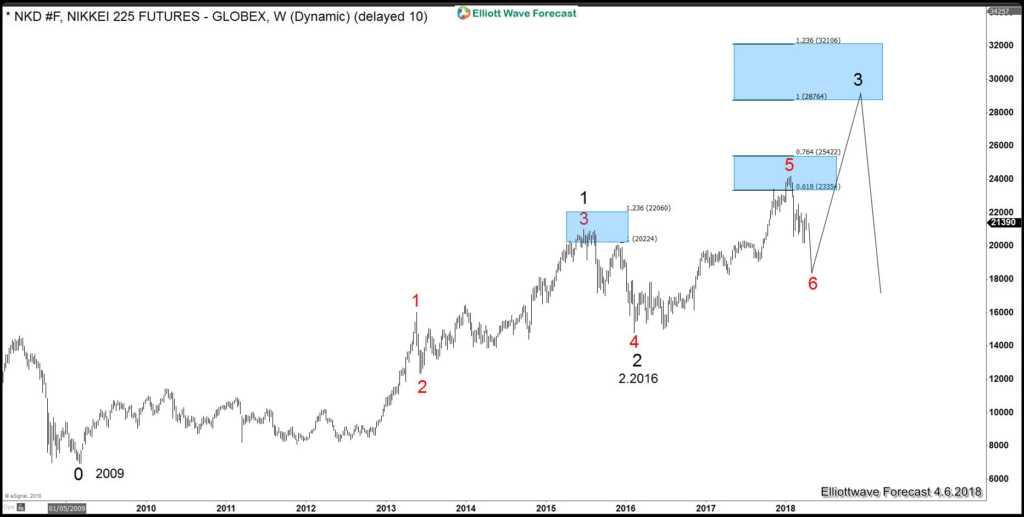
Firstly we will look at the Nikkei to highlight the idea that Indices larger pullback is technical rather than fundamental. It is very obvious by looking at the chart below that we have been in an uptrend. Since the lows in 2009, the rally in Nikkei shows a 5 swing sequence that favors further upside. Nikkei has now reached the area of 23354 – 25422 that is the .618 – .764 Fibonacci extension of the 2009 to 2015 cycle. This is measured from the beginning of the cycle from the 2009 lows on up to the 2015 highs then down to the 2016 lows. Most cases a fifth swing will end in this Fibonacci extension area which it appears to have done.
Thus at the current juncture the Nikkei is expected to continue a pullback in the 6th swing in 3, 7, or 11 swings to correct the cycle up from the 2016 low. The expected correction in this 6th swing is similar in nature to the 2nd swing pullback of 2013 although it likely will end up to be a larger pullback. Afterward of completion of the 6th swing pullback it should see more upside in 7th swing. The black 3 marks the target area for this next swing higher in the bullish sequence.
Nikkei Weekly Swings: Indices Larger Pullback
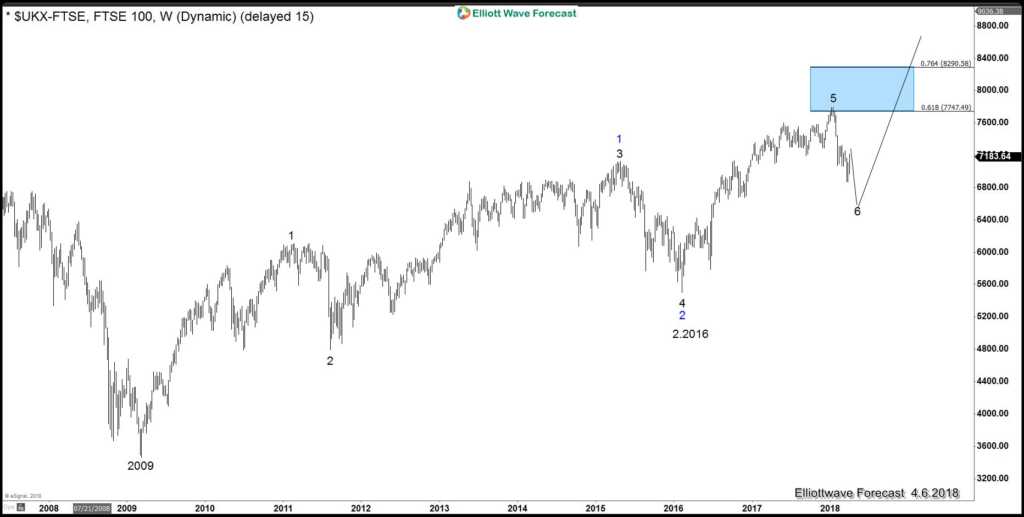
Next we will look at the FTSE weekly swings which also confirms that Indices larger pullback in Q1 2018 was based on technical reasons. The first thing to note again is the bullish uptrend since the 2009 lows. The FTSE shows a 5 swing sequence that favors further upside and has reached the area of 7747 – 8290 which is the .618 – .764 Fibonacci extension of the 2009 to 2015 cycle. This is measured from the beginning of the cycle from the 2009 lows on up to the 2015 highs then down to the 2016 lows. Most cases a fifth swing will end in this Fibonacci extension area which it appears to have done.
At this current juncture the FTSE is expected to continue a pullback in the 6th swing in 3, 7, or 11 swings to correct the cycle up from the 2016 low. That should be similar to the 2nd swing pullback of 2013. Afterward of completion of the 6th swing pullback it should see more upside in the 7th swing toward equal legs or better of the 2009 to 2015 cycle which begins around the 9175 area.
FTSE Weekly Swings
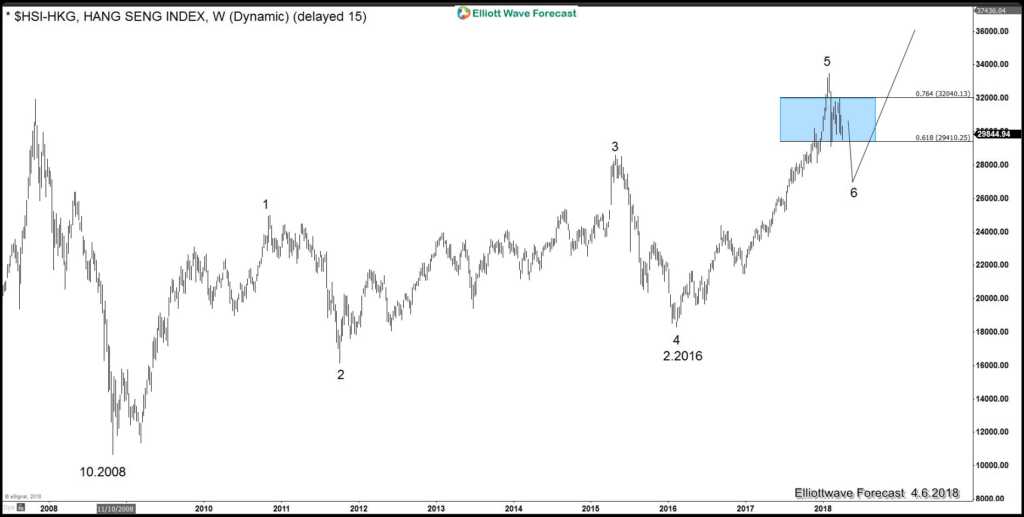
Lastly we will look at the Hang Seng Index weekly swings. This also supports the same idea of Indices larger pullback being based on technicals rather than fundamentals. There is the familiar bullish uptrend since the 2008 lows. Like the Nikkei and FTSE, the Hang Seng index shows a 5 swing sequence that favors further upside. It has reached and exceeded the area of 29410 – 32040. That is the .618 – .764 Fibonacci extension of the 2008 to 2015 cycle. This is measured from the beginning of the cycle from the 2008 lows on up to the 2015 highs then down to the 2016 lows. As previously mentioned in most cases a fifth swing will end in this Fibonacci extension area however this index has been a bit more bullish.
At this juncture, the Hang Seng pullback from the 5th swing high ended the cycle up from the 2016 lows. It is expected to continue a pullback in the 6th swing in 3, 7, or 11 swings to correct the cycle up from the 2016 low. This should be similar to the 2nd swing pullback of 2011. Afterward of completion of the 6th swing pullback it should see more upside in the 7th swing toward 36314.
Hang Seng Weekly Swings
In conclusion the above charts show the swing counts with the 5th swing Fibonacci extension areas reasoning. That is why the up trends have stalled. That is why they are currently in pullbacks lower that are only a normal and healthy market correction. Expect the progression of mankind resumes higher.
Thanks for looking. Feel free to come visit our website. Please check out our services Free for 14 days to see if we can be of help.
Kind regards & good luck trading.
Lewis Jones of the ElliottWave-Forecast.com Team
Back


