HPQ Inc Stock Update: The stock remain a buy the dips.
Overall:
Approximately 3 weeks ago we covered HPQ Inc, just few days before the Earning Report the 23rd of August and analyzed the stock in the weekly time frame where we mentioned that the overall view of the stock remains bullish.
HPQ HP Inc Earnings Report and Price Analysis for 08/23/17
Below the key points of the HP Inc. Earnings Report for the Third Quarter of 2017
-
Net revenue of $13.1 billion, up 10% as reported and up 11% in constant currency from the prior-year period
-
GAAP diluted net earnings per share from continuing operations of $0.41, above the previously provided outlook of $0.36 to $0.40 per share
-
Non-GAAP diluted net earnings per share of $0.43, within the previously provided outlook of $0.40 to $0.43 per share
-
Cash provided by operating activities of $1.8 billion
-
Third quarter returned $524 million to shareholders in the form of share repurchases and dividends
Source: http://h30261.www3.hp.com/news-and-events/news-library/2017/08-23-2017.aspx
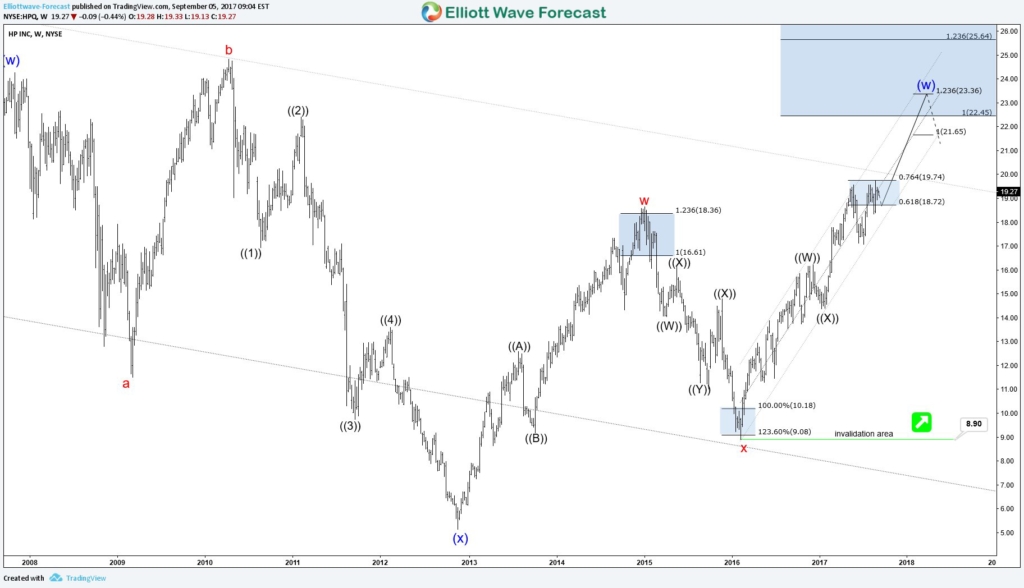
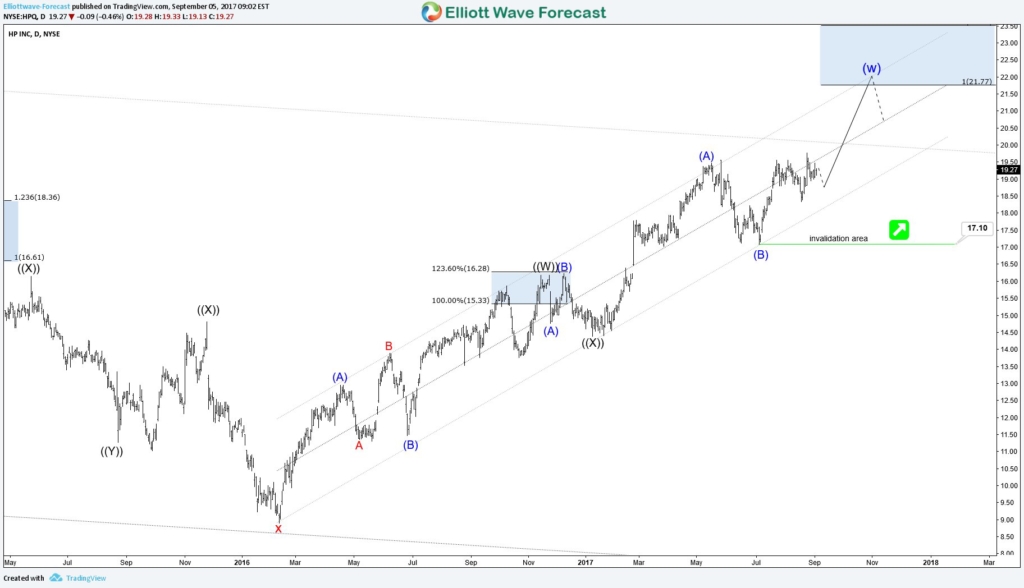
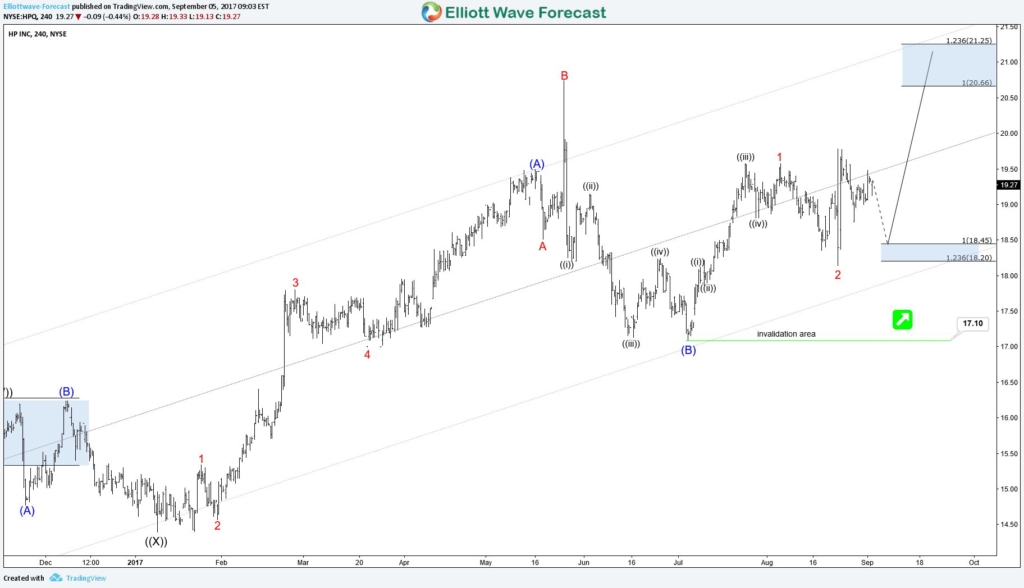
Overall, the HPQ Inc stock has multiple targets pending to the upside within multiple cycles, that are the equal legs – 1.236% extensions of specif swings since the 5.08 lows. Below, we are going to explain each case per each time frame.
HPQ Inc Stock: Weekly Time Frame
Starting from the weekly time frame, as we mentioned before during the earning report, HPQ remains Bullish. At this stage we would like to see a break above the multi year descending trend line around the 20’s. If the case, we should be validating a bullish break above the larger time frame descending channel and from there see price extending towards the 22’s – 25’s area to reach the equal legs – 1.236% extension from the 11/19/2012 cycle at the 5.09 lows, which would be the target at the weekly time frame.
HPQ Inc Stock: Daily Time Frame
In the Daily time frame, HPQ has another set of of equal legs – 1.236% extension waiting at the 21.77 – 23.50 zone. Those equal legs are calculated from the X red low, that is the start of the 02/11/16 cycle from the 8.88 lows. At this stage and while price remains above the 18.32 first and 17.10 second we should see the extension towards the Blue Box, with targets the 21’s – 23’s area as mentioned above.
HPQ Inc Stock: 4 Hour Time Frame
In the 4 Hour Time frame, we have a short term bullish sequence with the 07/06 cycle and from the lows at 17.10 which is by the way our invalidation level for this time frame. At this stage we would like to see price do one more leg to the downside towards the 18.50’s – 18.20’s and from there buy the dip against the 17.10 pivot with target the equal legs – 1.236% extension at the 20.63 – 21.21 zone or at least a 3 wave bounce which would set our trade risk free after setting our stop loss to break even. In the case we don’t see the pull back to the level lower, then we could buy the pull back in 3, 7 or 11 swings after price extend to new highs.
Conclusion: HPQ Bullish in 3 Time Frames
HPQ can be bought in many time frames as the stock still have not reached the targets of the equal legs – 1.236% extensions in the Weekly, Daily and 4 Hour time frame. Depending on your trading style you could trade one of the above time frames or even best, fine tune the trade from the 4 Hour with targets the Weekly, creating a very good Risk 2 Reward Ratio Setup.
If you have found our analysis interesting, we are almost certain you will enjoy our new plan covering 13 Stocks & 13 ETFs. We provide Daily Technical Analysis in the Weekly, Daily, 4 Hours and Hourly including Trading opportunities, Live Sessions and many more.
For limited time only, try us 14 Days for only $9.99
Back


