Fortinet Inc (NASDAQ: FTNT) is an American multinational corporation providing network security solutions such as firewalls, anti-virus, intrusion prevention and endpoint security.
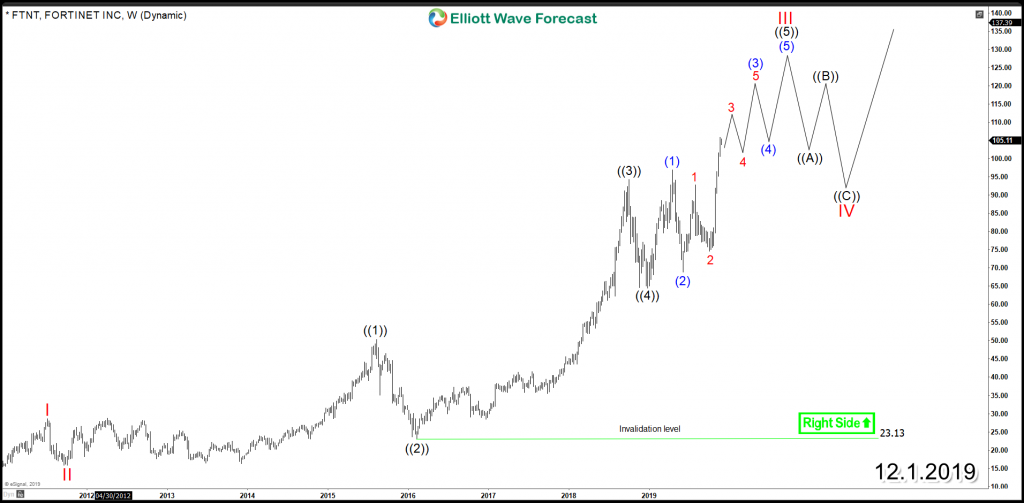
Since IPO, the stock started a bullish cycle within an impulsive Elliott Wave structure which is currently still in progress. It’s expected to continue making new all time highs as the more aggressive view is suggestion further extension higher within wave (3) of ((5)) while October 2019 low is holding which can reach target area $113 – $122 from where a 3 waves pullback takes place before it resume the rally again.
FTNT Weekly Chart
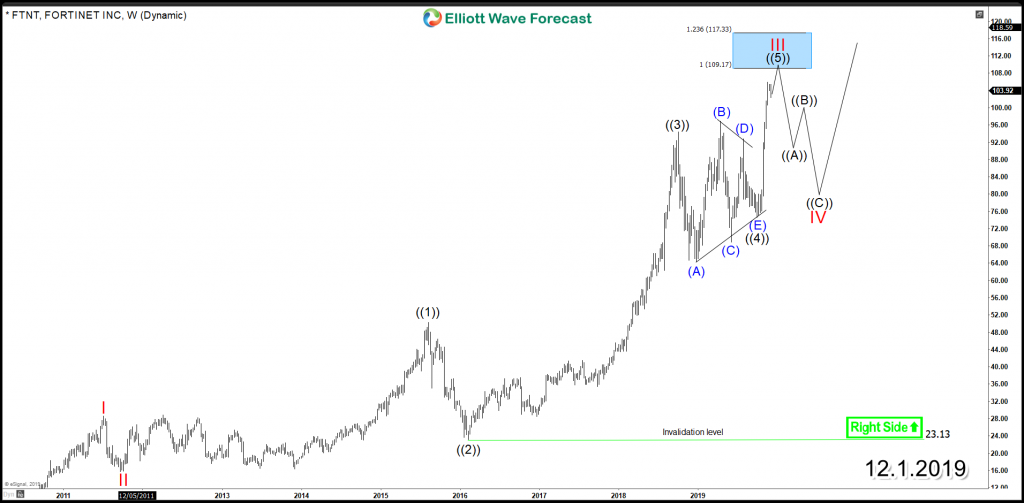
The lesser aggressive view for FTNT would suggest the recent price action since 2018 peak was a triangle consolidation in wave ((4)) followed by a thrust in wave ((5)) with another extension higher toward equal legs area $109 – $117. Down from there a larger 3 waves pullback can take place in wave IV before buyers again will show up looking to resume the main bullish trend.
FTNT Weekly Chart Alternative View
Conclusion
FTNT is Showing an impulsive structure from all time lows and looking to remain supported in 3 or 7 swing pullbacks as long as 2018 and 2019 lows remains in place.
Get more insights about the Technology Sector and learn how to trade our blue boxes using the 3, 7 or 11 swings sequence by trying out our services 14 days . You will get access to our 78 instruments updated in 4 different time frames, Live Trading & Analysis Session done by our Expert Analysts every day, 24-hour chat room support and much more.
Back


