Hello fellow traders. In this technical article we’re going to take a look at the Elliott Wave charts charts of S&P 500 E-Mini (ES_F) Futures published in members area of the website. Our members know ES_F completed cycle from the 4964 low as a 5 waves pattern. Currently the futures is giving us correction against the mentioned low. In this discussion, we’ll break down the Elliott Wave pattern and forecast.
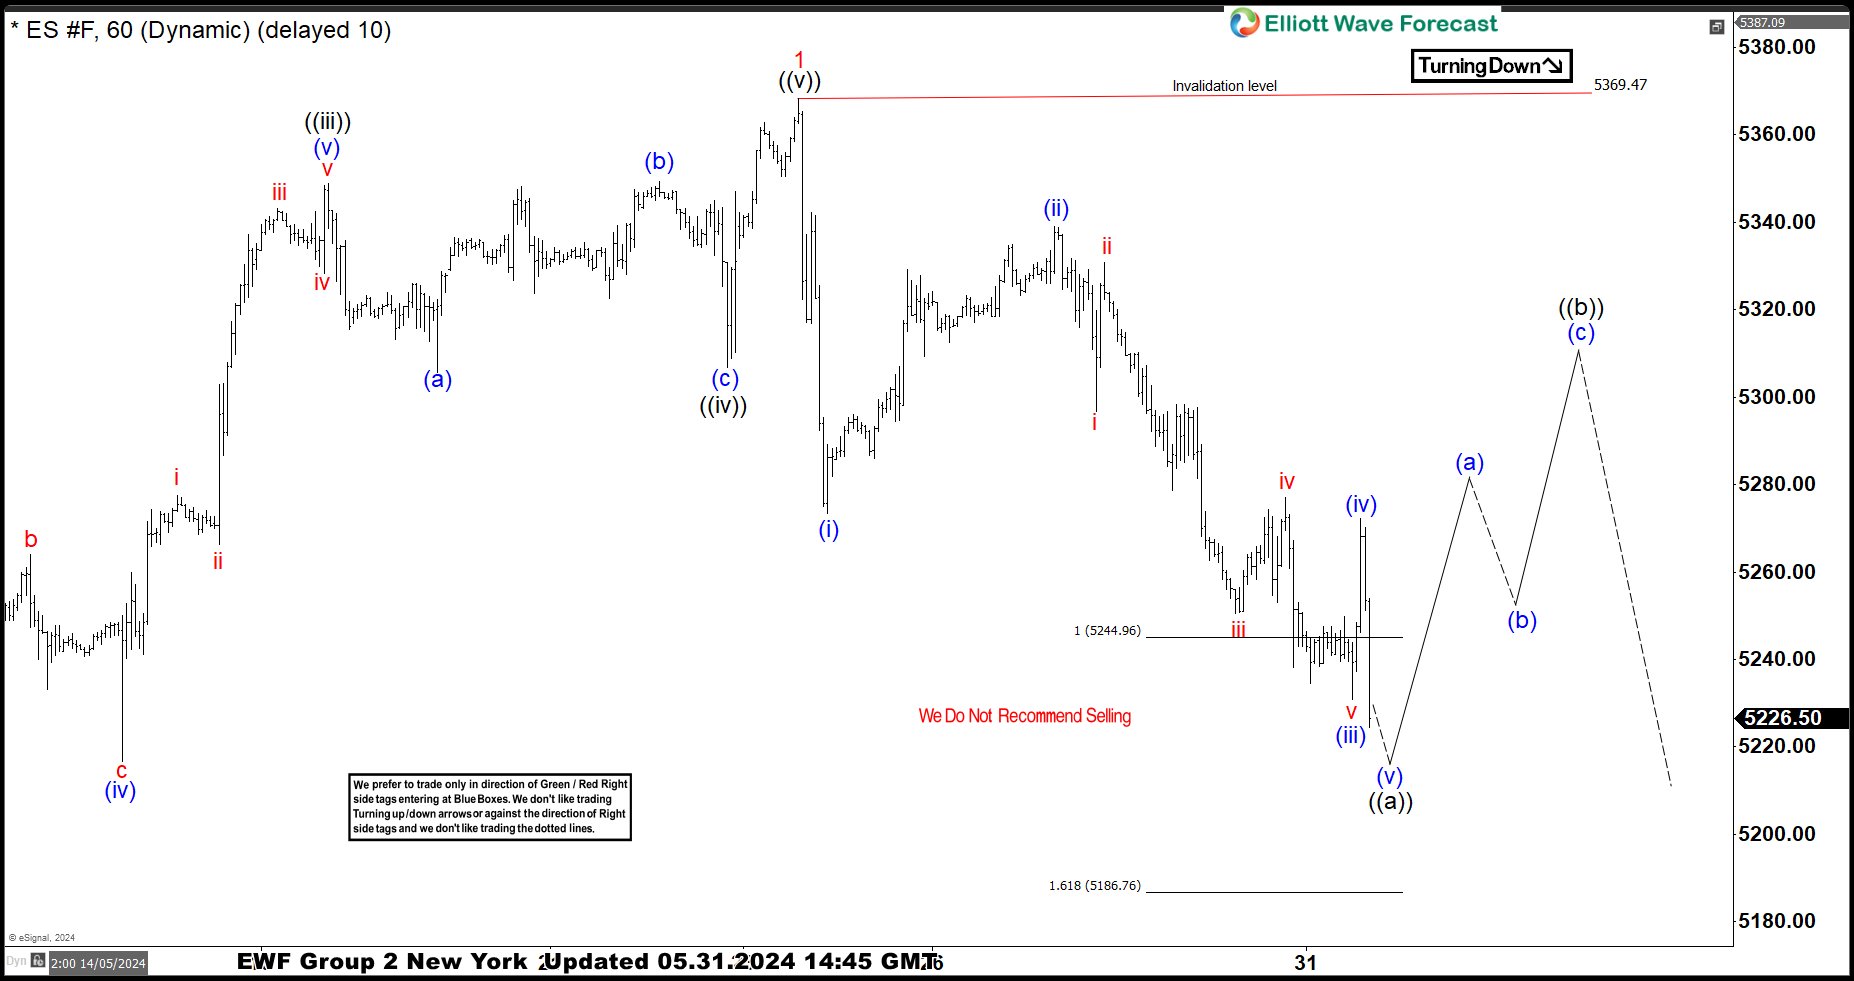
ES_F Elliott Wave 1 Hour Chart 05.31.2024
ES_F reached extreme zone from the 5369.47 peak at 5244.9-5186.7 area. The futures shows clear 5 waves from the high, suggesting pull back is unfolding as Elliott Wave Zig Zag pattern. ES_F is about to complete first leg ((a)) black of 2 red. We expect rally in wave ((b)) to happen any moment. We recommend members to avoid selling the futures and keep favoring the long side.
Official trading strategy on How to trade 3, 7, or 11 swing and equal leg is explained in details in Educational Video, available for members viewing inside the membership area.
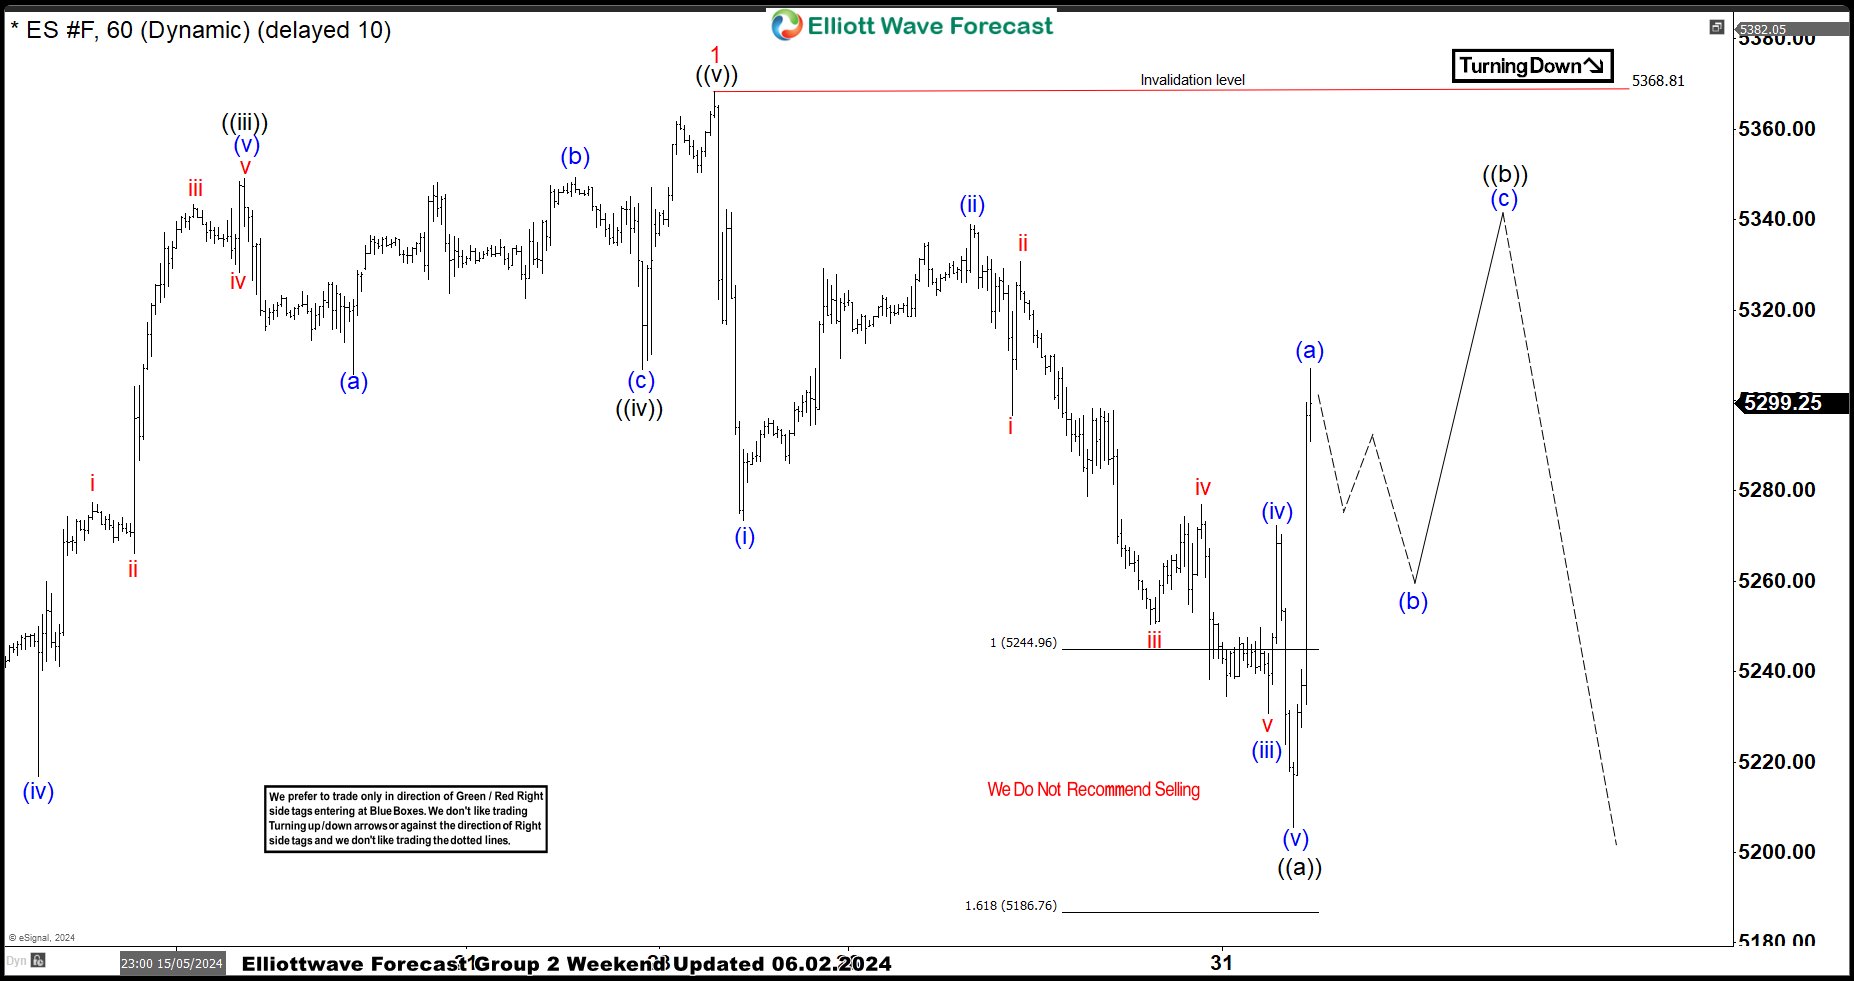
ES_F Elliott Wave 1 Hour Chart 06.02.2024
ES_F found buyers at the extreme zone as expected. The index has reacted strongly from the Equal Legs Area. Rally from the low looks impulsive, which suggests we are about to complete first leg of wave ((b)) recovery, which is also unfolding as Elliott Wave Zig Zag pattern. As far as the pivot at 5368.81 pivot holds, another leg down can be see once ((b)) black completes.
Keep in mind that market is dynamic and presented view could have changed in the mean time. You can check most recent charts with target levels in the membership area of the site. Best instruments to trade are those having incomplete bullish or bearish swings sequences. We put them in Sequence Report and best among them are shown in the Live Trading Room
New to Elliott Wave ? Check out our Free Elliott Wave Educational Web Page and download our Free Elliott Wave Book.