EQT Corporation (NYSE: EQT) found a strong buying opportunity in the 2023 Blue Box Area, allowing the stock to resume its rally toward new all-time highs. Moreover, in today’s article, we explore the Elliott Wave structure, highlighting potential paths and targets for its continued bullish momentum.
EQT Weekly Chart

Elliott Wave Analysis
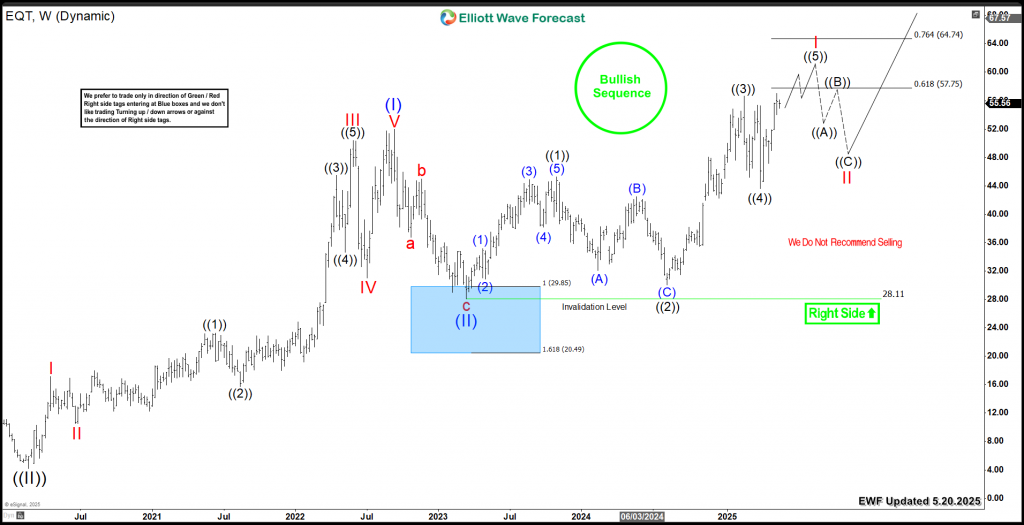
The weekly chart of EQT highlights its advance from the 2020 low, with wave (I) peaking at $51.97, followed by a 3-wave pullback in wave (II) that ended at $28.11. After that, the stock confirmed a bullish sequence by reaching new all-time highs, signaling the continuation of wave (III).
Currently, EQT is progressing through a 5-wave advance from its 2023 low, steadily approaching the 61.8% Fibonacci extension zone at $57.75 – $64.74, where wave I of (III) could complete. Moreover, once this level is reached, a wave II pullback is expected, providing a buying opportunity in 3, 7, or 11 swings. Furthermore, the stock remains supported, with the next upside target aiming for the equal legs area between $76 – $105.
Conclusion
The bullish Grand Super Cycle for EQT continues, creating opportunities to buy daily and weekly corrective pullbacks using our Elliott Wave strategy. The best approach involves entering after the stock completes a 3, 7, or 11 swing sequence from its peak. Moreover, our extreme Blue Box system improves precision, helping traders identify entry points with clarity and confidence.
Explore our system to gain deeper insights into this methodology.
Unlock the power of Stocks & ETFs investing with our Exclusive 14-Day Trial!
✅ Master Blue Box trading using the 3, 7, or 11 swing sequence
✅ Access 78 instruments analyzed across four time frames
✅ Join live trading & analysis sessions hosted daily by expert analysts
✅ Enjoy 24-hour chat support and much more
Don’t miss this chance to refine your strategy and gain fresh insights. Start your journey today!


