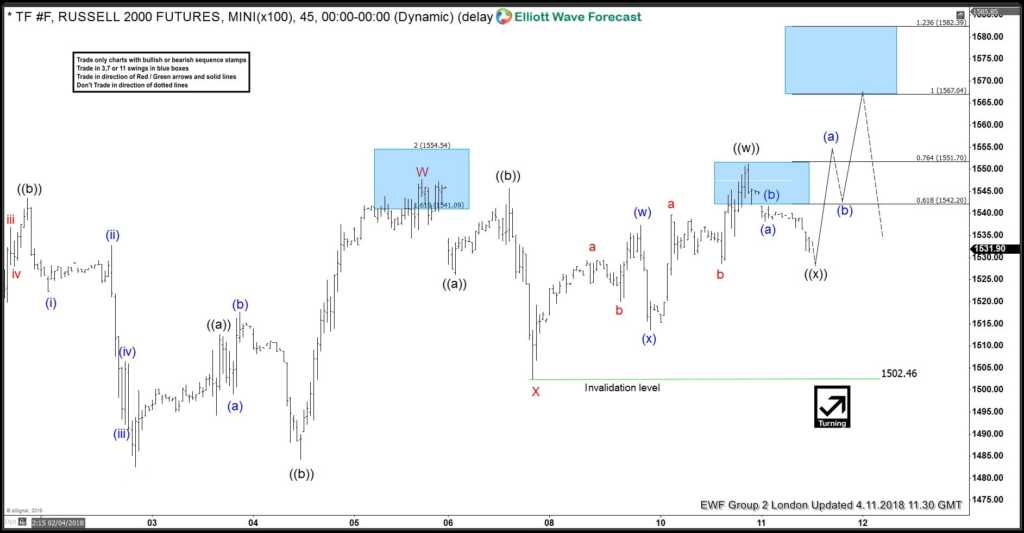
In this blog, I will show you some short-term Elliott Wave charts of Russell which we presented to our members in the past. Down below, you see the 1-hour updated chart presented to our clients on the 04/11/18 calling for more upside in a Double Elliott Wave correction in red W-X.
Russell ended the cycle from 03/13 peak, at around the areas of 1482 (04/02 low). Down from there, it started a recovery to the upside. The pullback can unfold either in 3-7 or 11 swings. After ending the cycle from 03/13 peak, the index started a recovery in red wave W-X. We mentioned to our clients that the market should ideally end the correction from 04/02 low at the equal legs area of red W-X, which comes at around 1567.04+ areas. As it broke the red wave W 04/05 highs, the market opened up a short-term sequence from 04/02 low, confirming the next leg higher. However, short-term it corrected the cycle from 04/06 lows (1502.46) in black wave ((x)) first before the next move to the upside can be seen.
Russell 04.11.2018 1 Hour Chart Elliott Wave Analysis
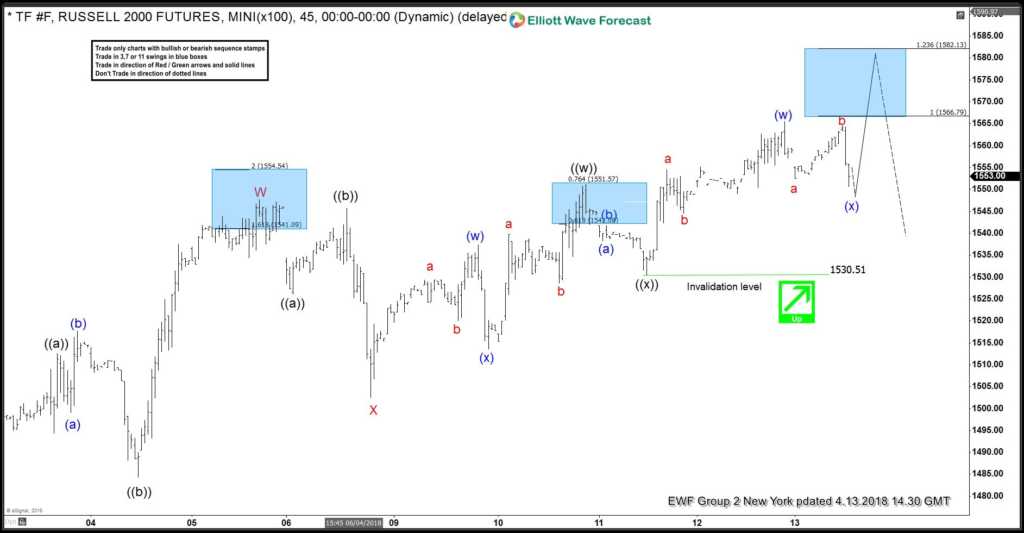
As I said in the paragraph above. Russell confirmed the next move higher due to the break above the highs of red wave W. In the last Elliott Wave chart, you can see that the instrument has ended black wave ((x)) and rallied nicely to the upside. You can see that the instrument has reached the equal legs at around 1567.04+ areas. Ideally, Russell corrects now the cycle from 04/02 lows at least in 3 waves. Either for new lows or another correction higher in 7 swings. That needs to be seen at this stage.
Russell 04.13.2018 1 Hour Chart Elliott Wave Analysis
I hope you enjoyed this blog and I wish you all good trades.
We believe in cycles, distribution, and many other tools in addition to the classic or new Elliott Wave Principle.
Join us today for a FREE 14 Days trial and see our latest trading setups and charts.
Back


