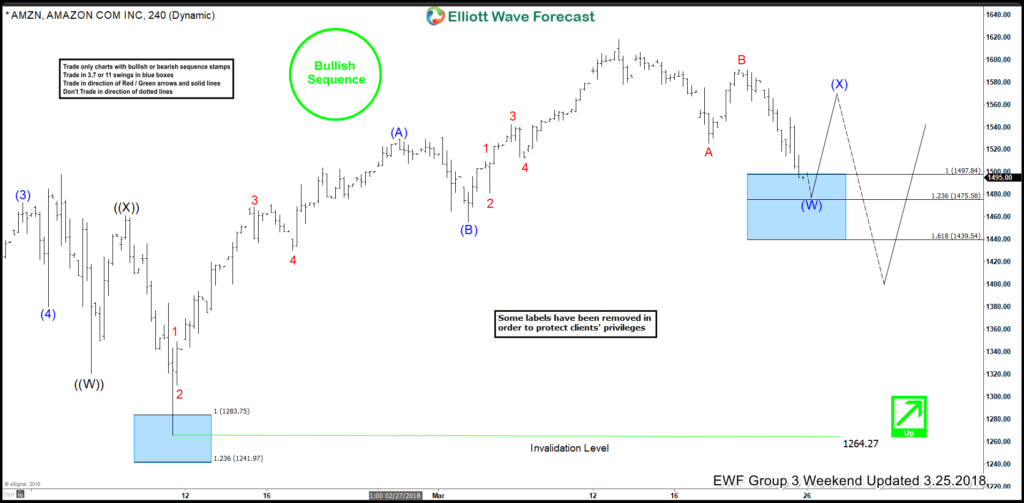
In today’s blog, we will have a look at some past short-term Elliott Wave structures of the Amazon stock which we presented to our members. In the first chart below, you can see the 4-hour weekend update chart presented to our members on the 03/25/18. Calling for a bounce in 3 waves at least to the upside.
Amazon ended the cycle from 02/09 low. Therefore, we suggested to our members that the stock can correct that mentioned low either in 3-7 or 11 swings. With Global Indices calling for another extension lower, especially the European once. We said to members that the Amazon stock is not ready for any big move to the upside yet. However, we also mentioned that a bounce in 3 waves to the upside at least should occur as Amazon reached the extreme areas from 03/13/18 peak.
AMZN 03.25.2018 4 Hour Chart Elliott Wave Analysis
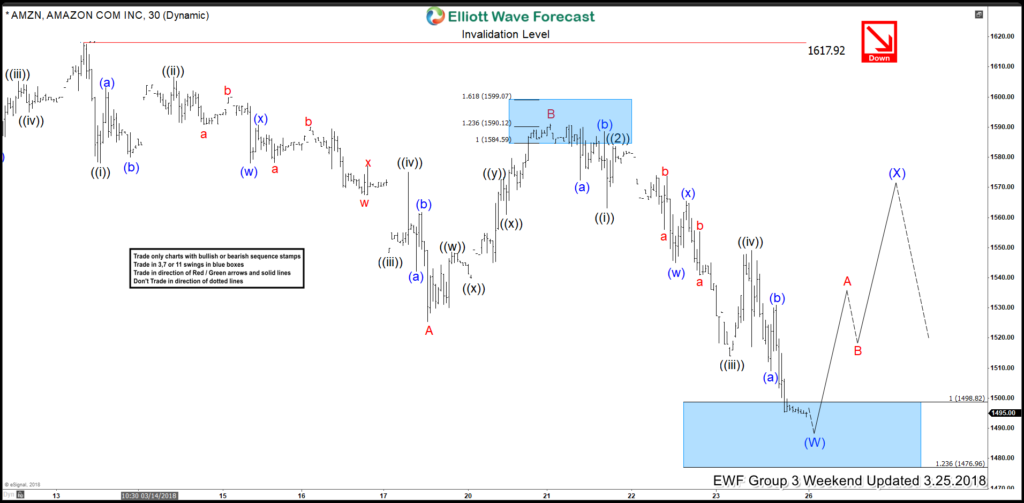
In the 1-Hour Elliott Wave chart below, you can see that Amazon was overall bearish in short-term. However, it reached the equal legs area from red A-B between $1498.82-$1476.96 (03/13 peak). Therefore, we warned members that the stock can correct 03/13 peak in 3-7-11 swings before another leg of weakness should be taken place.
AMAZON 03.25.2018 1 Hour Chart Elliott Wave Analysis
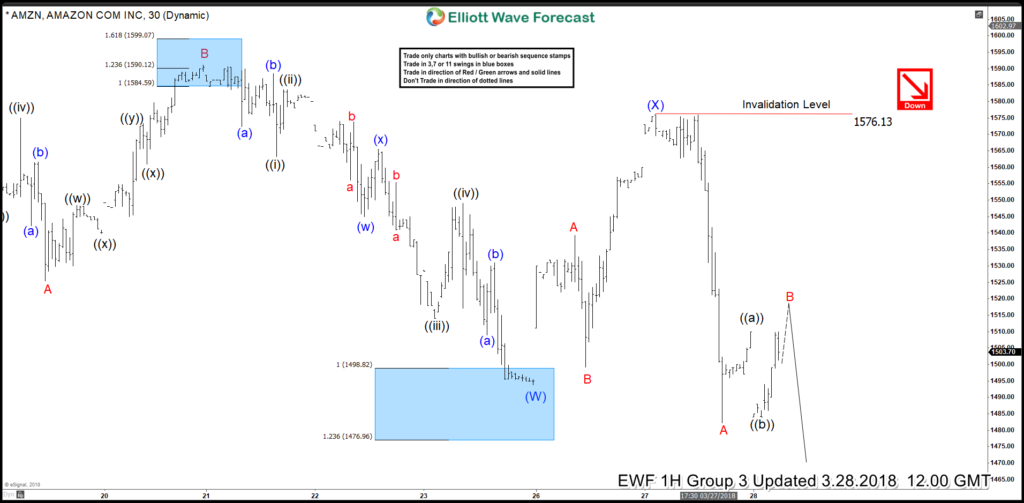
The last Elliott Wave chart below, which we presented to members on the 03/28. We nicely can see that Amazon reacted from the $1498.82-$1476.96 equal legs area. In 3 waves as red A-B. You can see that the market failed in 3 waves and made another low as forecasted in the first 4-hour chart. We already mentioned to members that Amazon should trade lower based on the “One Market Only” Approach.
AMZN 03.28.2018 1 Hour Chart Elliott Wave Analysis
I hope you enjoyed this blog and I wish you all the best.
We believe in cycles, distribution, and many other tools in addition to the classic or new Elliott Wave Principle.
Join us today for a FREE 14 Days trial and see our latest trading setups and charts.
Back


