Antero Resources is an U.S. american corporation which has its headquarters in Denver, USA. Founded in 2008 and traded under tickers $AR at NYSE, it is a component of the Russel1000 index. Antero Resources is the 3rd largest U.S. producer of natural gas and possesses the reserves entirely within the Appalachian Basin. Using hydraulic fracturing, it extracts natural gas, ethane and natural gas liquids. Currently, we can see natural gas turning higher after the years of depressed prices. Therefore, Antero Resources being a pure player in that awakening commodity should become a good opportunity for investors to participate in the anticipated rally in gas prices.
Antero Resources Daily Elliott Wave Analysis 08.26.2020
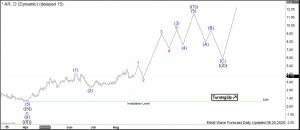
The daily chart below shows the Antero Resources shares $AR traded at New York Stock Exchange. Before 2020, we saw an important price decline in $AR shares. Without any doubt, this development had its origin in the gas bear market. In March 2020, however, the stock price might have ended the grand super cycle correction in wave ((II)). From the March lows at 0.64, at first, $AR has developed a cycle higher in wave (1). It has printed a top in June at 4.15. Practically, that advance in only 3 months has provided a 6.5 multiplication to the share prices.
From the June highs, a correction lower in wave (2) has unfolded as a regular flat pattern being a 3-3-5 structure. The same month, it has found a bottom at 2.30. In the following, a new cycle higher has started. Hereby, the price has broken above the June highs at 4.15, confirming that the wave (3) is in progress.
Antero Resources 4H Elliott Wave Analysis 08.26.2020
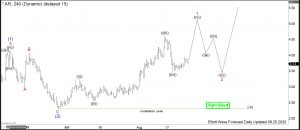
The 4H chart below shows the $AR shares price action in more detail. From the June lows at 2.30, the stock price has advanced in waves ((i)) through ((iii)) of red wave 1. Consequently, after a pullback in wave ((iv)), an extension higher in wave ((v)) of 1 should take place. Later on, expect a pullback in wave 2 to find support in 3, 7 or 11 swings above 2.30 lows for a possible acceleration in wave 3 of (3).
As an outlook, wave (3) can bring the prices towards 5.82-8.00 area and beyond. At current price levels, investors in gas prices have a good opportunity to enter the market with a great potential to the upside.
Get more insights about Stocks and ETFs by trying out our services 14 days . You’ll learn how to trade the market in the right side using the 3, 7 or 11 swings sequence. You will get access to our 78 instruments updated in 4 different time frames, Live Trading & Analysis Session done by our Expert Analysts every day, 24-hour chat room support and much more.
Back


