American Express Company (Amex), symbol AXP, is an American multinational financial services corporation that specializes in payment cards. Headquartered in New York City, it is one of the most valuable companies in the world and one of the 30 components of the Dow Jones Industrial Average.
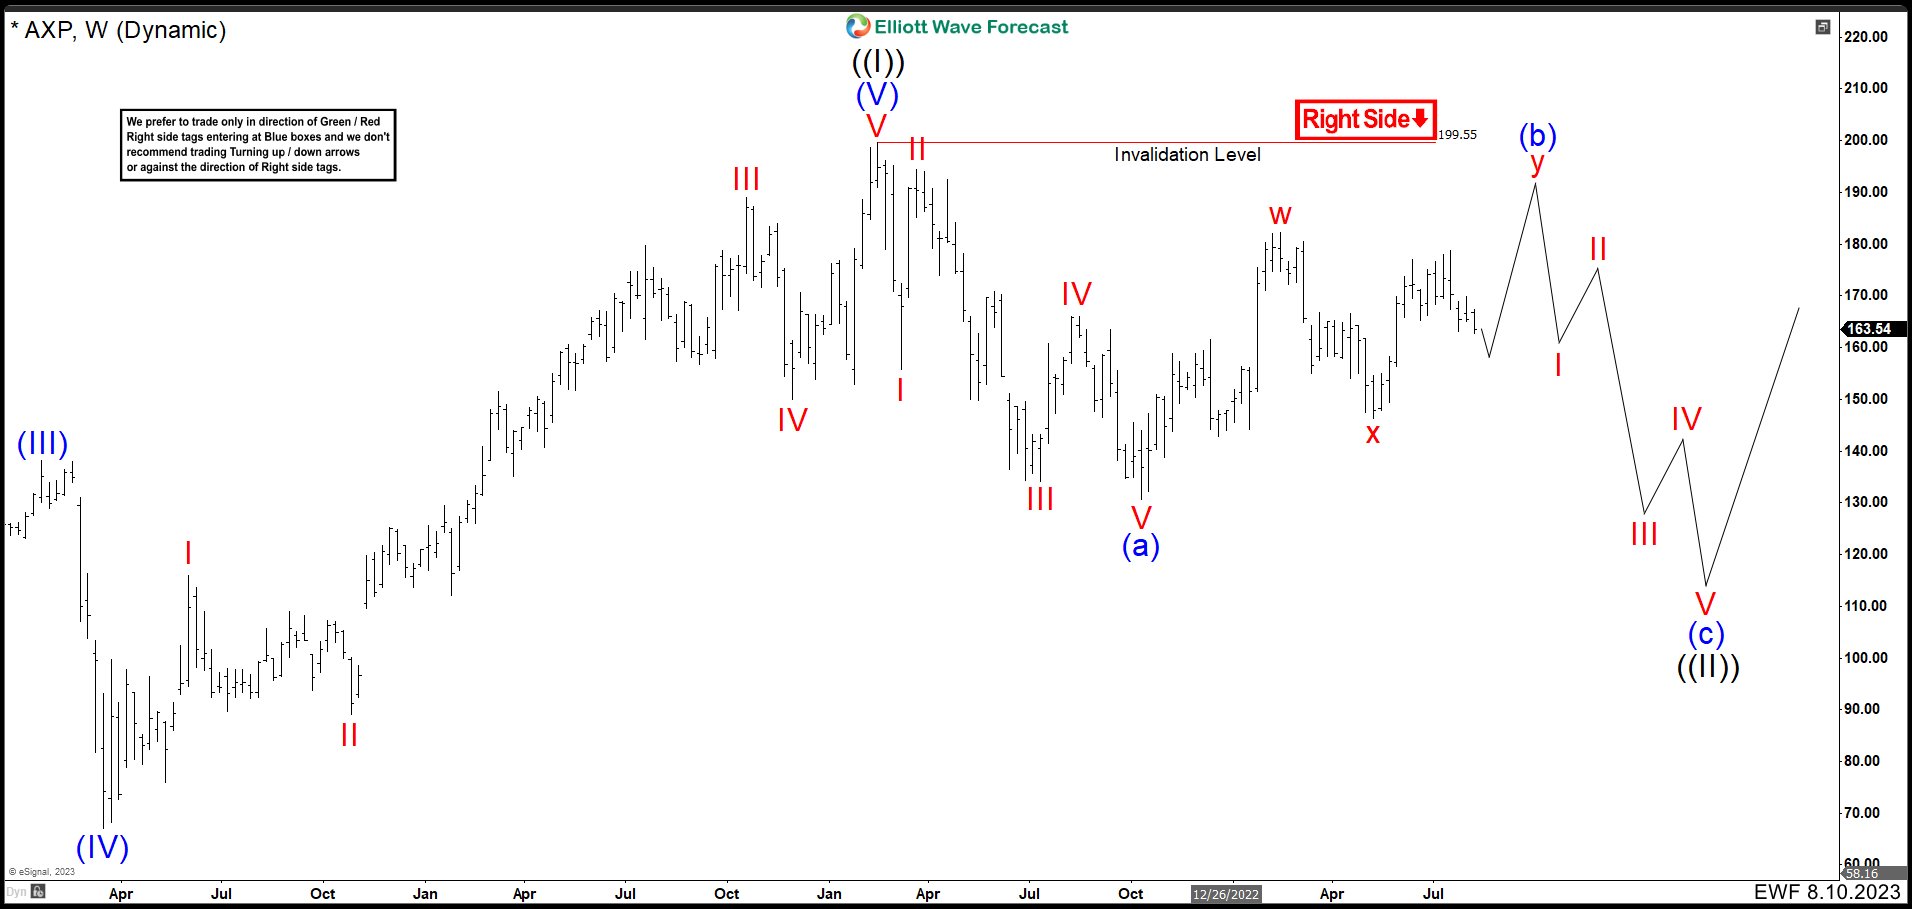
AXP Weekly Chart August 2023
We believe that the AXP ended a Great Super Cycle at the peak of 199.55 which we call wave ((I)). From there, started a bearish structure (a), (b), and (c). Wave (a) built a leading diagonal. The first fall reached 155.72 ending wave I. The market rebounded strongly ending wave II at 194.35 and then continued with the bearish movement. We can see from wave II a clear impulse lower to complete wave III at 134.12. Then the wave IV correction ended at 166.06, within the wave I zone thus creating the leading diagonal. Finally, the last leg towards 130.65 ended wave V and wave (a) in October 2022.
In this month the structure of the corrective wave (b) began to develop. To date we see that it has already completed 3 swings higher, and it could have finished the correction of wave (b) without any problem. However, given the price action of markets like the SPX, DAX, and currencies like the dollar, everything points to wave (b) are going to perform a double correction. That is why the first 3 swings up completed the wave “w” at 182.15 and the connector “x” at 146.28. From here we look for 3 more swings up to complete wave “y” and wave (b) above 190.
When Could the Financial Crisis Start?
With the forecast of the retesting of the peak of 199.55 by wave (b), an Elliott Wave flat structure is being created. This means that wave (c) is going to have a strong bearish reaction as shown on the chart. 5 waves to the downside in the form of an impulse would be expected to complete wave (c) and wave ((II)) before continuing the rally. The start of this situation could occur in the last two months of 2023 or in the first 2 months of 2024. We must be vigilant, as apparently a financial crisis is coming next year. (If you want to learn more about Elliott Wave Theory, follow these links: Elliott Wave Education and Elliott Wave Theory).
Elliottwave Forecast updates one-hour charts 4 times a day and 4-hour charts once a day for all our 78 instruments. We do a daily live session where we guide our clients on the right side of the market. In addition, we have a chat room where our moderators will help you with any questions you have about what is happening in the market.
14 days Trial costs $9.99 only. Cancel anytime at support@elliottwave-forecast.com
Back


