Hello fellow traders,
As our members know we have had many profitable trading setups recently. In this technical article, we are going to present another Elliott Wave trading setup we got in American Airlines (AAL) . The stock completed correction precisely at the Equal Legs zone, referred to as the Blue Box Area. In the following sections, we will explain the trading setup in detail and present the targets.
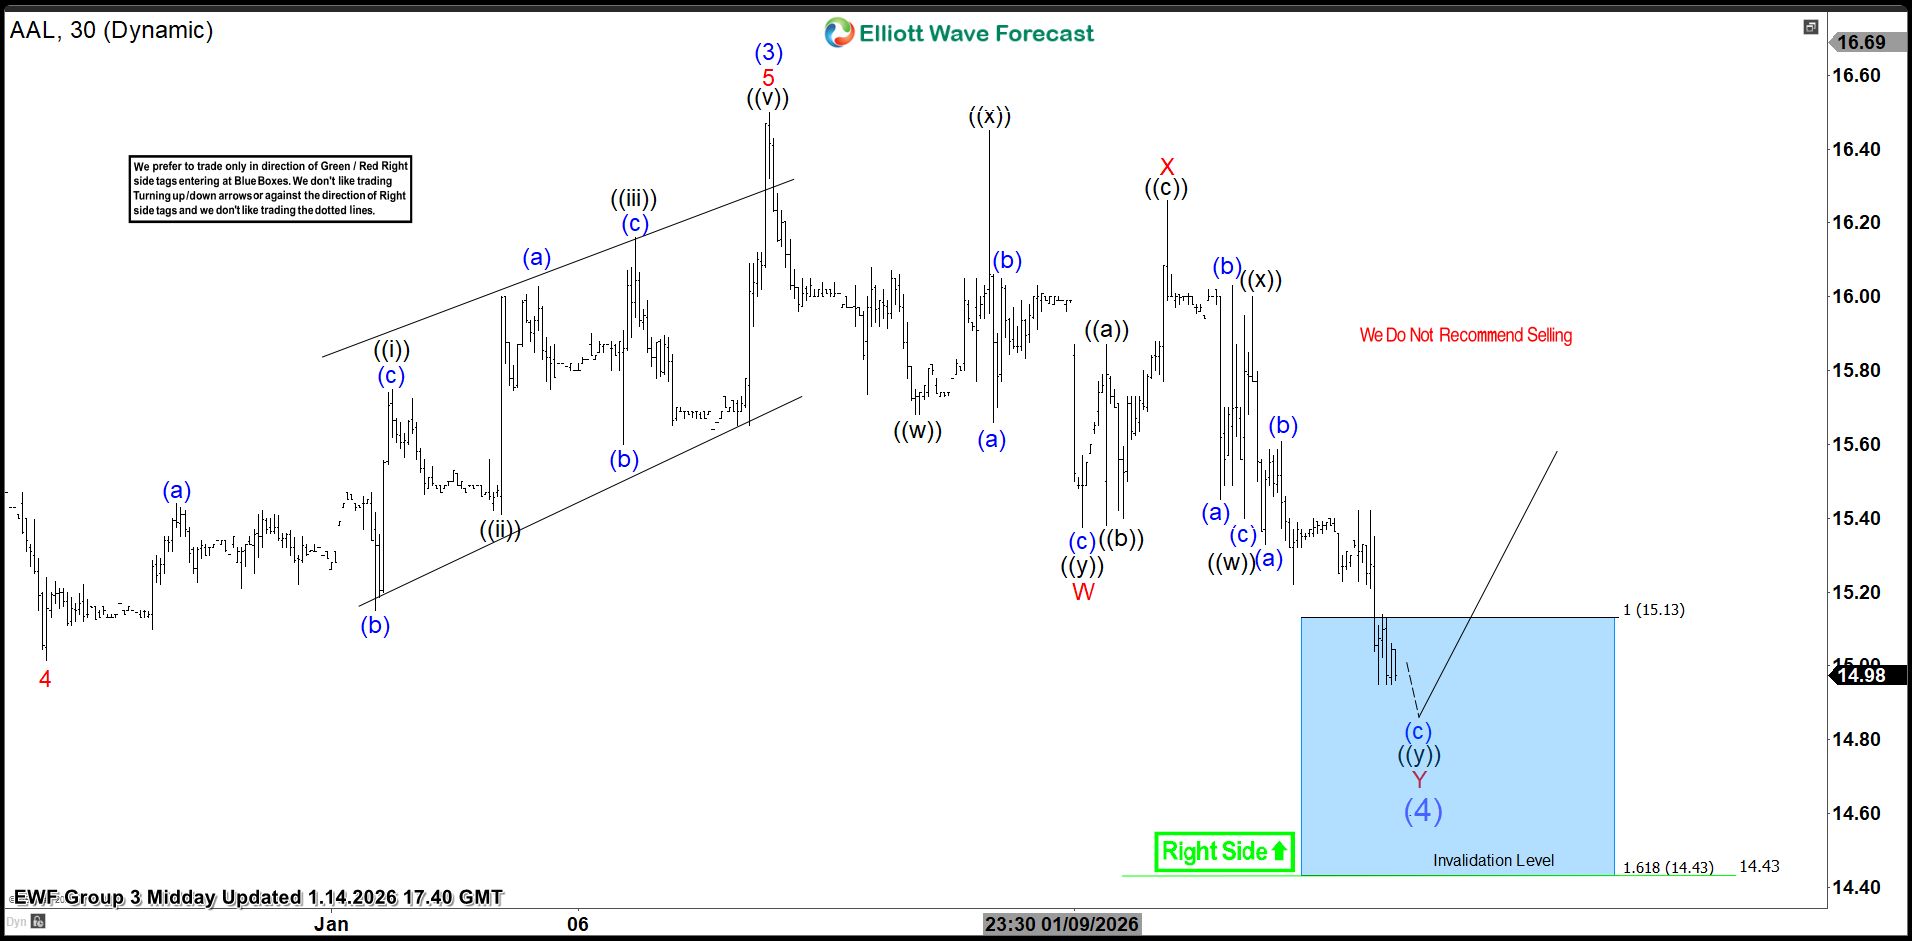
AAL Elliott Wave 4 Hour Asia Chart 1.14.2026
Current view suggests AAL stock is doing wave (4) blue correction. The price has reached extreme zone at 15.13-14.43 (blue box- buying area).
We’re entering long positions within the Blue Box. As the main trend remains bullish, we anticipate at least a 3-wave bounce from this area. Once the price touches the 50 fibs against the B red connector, we’ll make positions risk-free and set the stop loss at breakeven and book partial profits. Breaking below the 1.618 Fibonacci extension level at 14.43 would invalidate the trade.
Official trading strategy on How to trade 3, 7, or 11 swing and equal leg is explained in details in Educational Video, available for members viewing inside the membership area.
Quick reminder on how to trade our charts :
Red bearish stamp+ blue box = Selling Setup
Green bullish stamp+ blue box = Buying Setup
Charts with Black stamps are not tradable. 🚫
Did you know? 90% of traders fail because they don’t understand market patterns. Are you in the top 10%? Test yourself with this advanced Elliott Wave Test
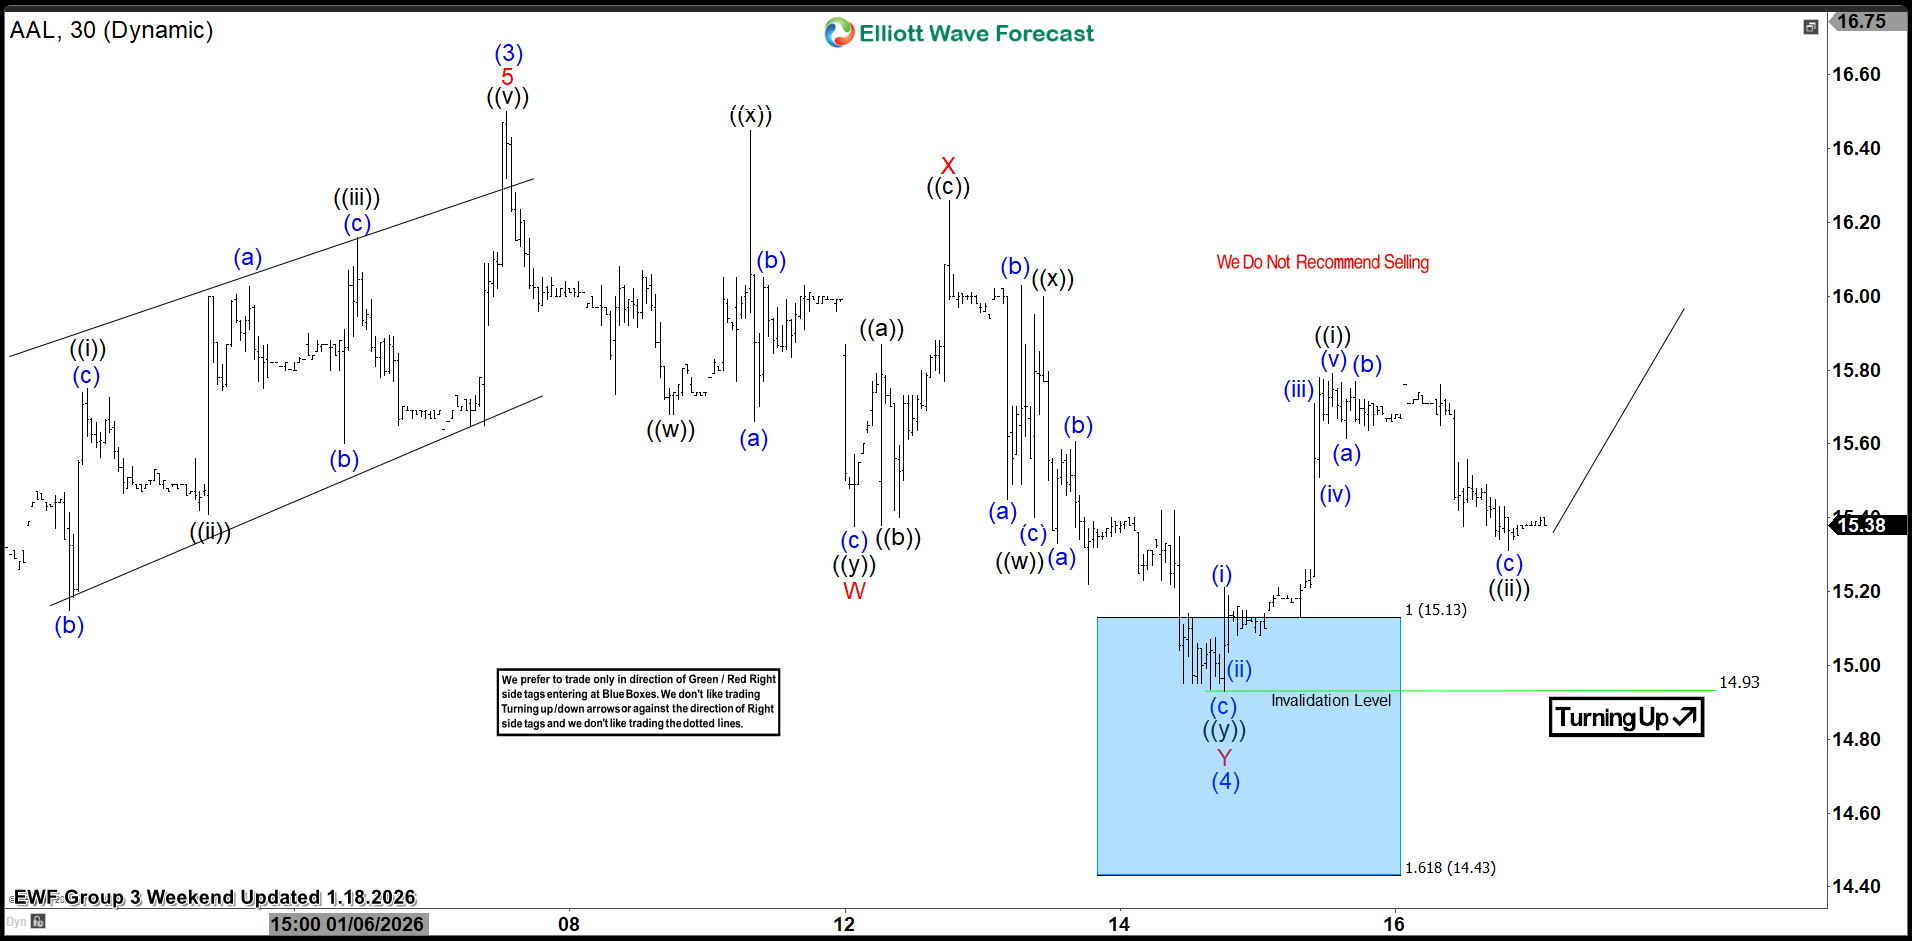
AAL Elliott Wave 4 Hour Asia Chart 1.14.2026
Keep in mind that market is dynamic and presented view could have changed in the mean time. You can check most recent charts with target levels in the membership area of the site. Best instruments to trade are those having incomplete bullish or bearish swings sequences. We put them in Sequence Report and best among them are shown in the Live Trading Room
Thank you for exploring our American Airlines (AAL) Trading Setup with us. While we analyze 78 instruments, it’s important to remember that not every chart represents a trading recommendation. For official trading signals, we invite you to join our Live Trading Room, where we provide actionable insights in real-time. If you’re not yet a member, take advantage of our 14-day trial to unlock new trading opportunities.
Over the years, we’ve developed a reliable trading strategy that clearly defines entry, stop loss, and take profit levels. By joining us, you’ll gain access to expert guidance and the chance to refine your trading skills
Join us today !
📈 Elevate your trading with Elliott Wave Forecast!
💻 Ask unlimited questions during trading hours (Monday to Friday). Our Chat Rooms are an excellent place to learn, with continuous support from our market experts!
🔍 Explore our expert insights and real-time analysis covering Forex, Indices, Commodities, Cryptocurrencies, Stocks, and ETFs across 78 instruments.
📊 Gain exclusive access to our Official Trading Recommendations in the Live Trading Room, where seasoned experts provide valuable insights and guidance on new trading opportunities.
💰 For just $9.99, unlock a wealth of knowledge and experience with our 14-day Trial. Experience firsthand our proven trading strategy, which accurately defines Entry, Stop Loss, and Take Profit levels, empowering you to make informed decisions with confidence.
👉 Ready to take the next step? Get your 14-day Trial in just a few clicks!
Offer Expires Soon!
Get full access to real-time Signals, Live Sessions, 24 Hour Chat Room Support and Expert Analysis — all for only $0.99 during your 14-day trial.
⏳ This limited-time price will expire soon — don’t miss out!
