Albemarle Corporation (ALB) develops, manufactures & markets engineered specialty chemicals worldwide. It operates through three segments, Lithium, Bromine & Catalysts. It also serves energy storage, petroleum refining, consumer electronics, construction, automotive, lubricants, pharmaceuticals & crop protection markets. It is headquartered in Charlotte, NC, comes under Basic Materials sector & trades under “ALB” ticker at NYSE.
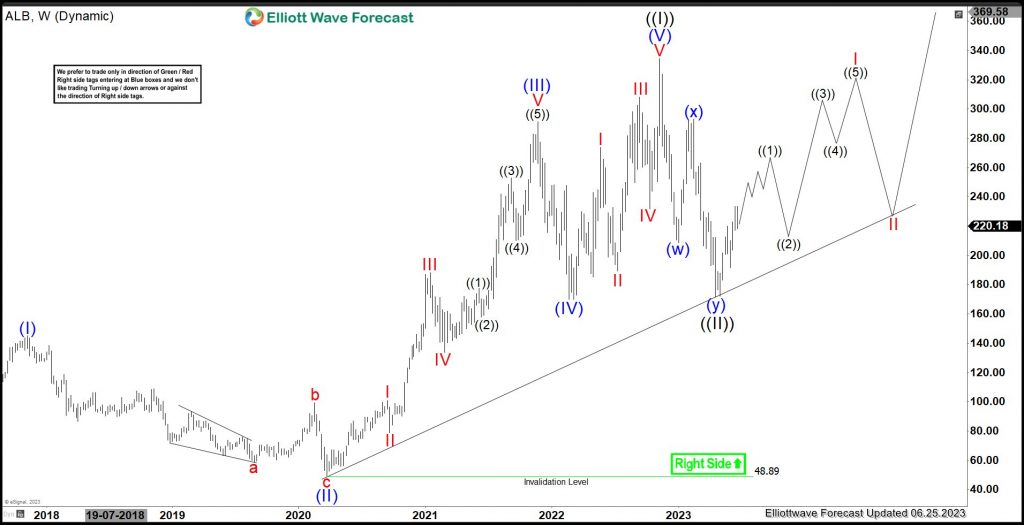
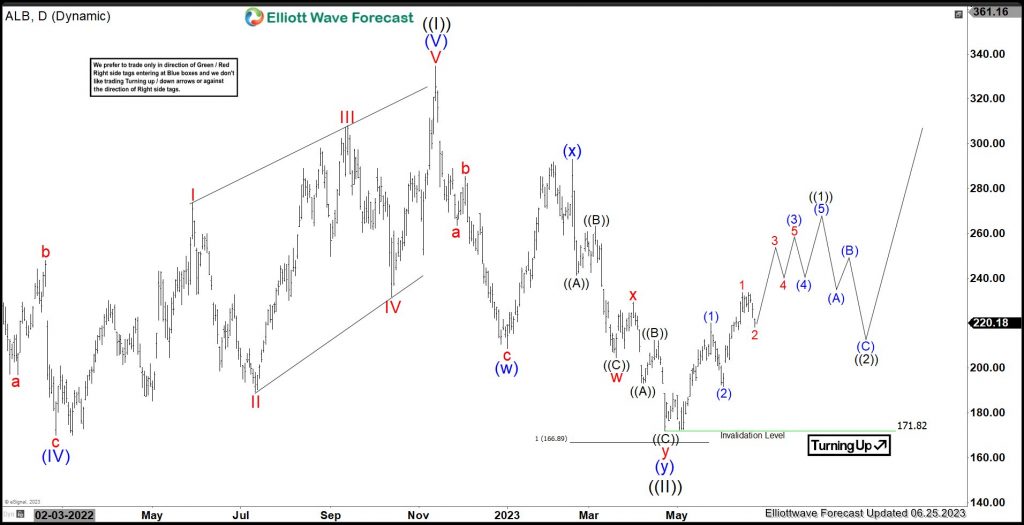
ALB finished ((I)) as impulse yearly sequence at $334.55 high. It finished ((II)) as double correction at $171.82 low. Above there, it favors higher in ((1)) of I of (I) of ((III)) & confirms further upside, when breaks above ((I)) high.
ALB – Elliott Wave Latest Weekly View: 
It placed (I) at $144.99 high in 2017 started from 1995 low. It corrected lower in (II), which ended at $48.89 low in March-2020 market sell-off. Above there, it favors ended (III) at $291.48 high as typical 1.618 Fibonacci extension of (I). It corrected lower in (IV) at $169.93 low as 0.5 Fibonacci retracement of (III). Finally, it ended (V) as diagonal structure at $334.55 high as ((I)) in November-2022. It corrected lower in ((II)) in 7 swing structure, which ended at $171.82 low in April-2023. ((II)) was slightly missed to equal leg areas & started turning higher.
ALB – Elliott Wave Daily Latest View: 
Above ((II)) low, it favors higher in ((1)) of I & expect further upside as aggressive view before correcting in ((2)). It placed (1) at $220.10 high & (2) at $191.65 low. It placed 1 of (3) at 233.74 high & favors lower in 2 of (3), which should remain above (2) low to resume higher in 3 of (3) in 9 swing sequence as ((1)) expecting few more highs to finish it. Alternatively, it can be diagonal ((1)), which will end with one more high before correcting in ((2)). As long as price remains above ((II)) low, it expects further upside either as the part of ((III)) higher or can be 3 swing corrective bounce, which may fail below ((I)) high before turning lower in larger ((II)) correction in Yearly sequence.
Elliottwave Forecast updates 1-hour charts four times a day & 4-hour charts once a day for all our 78 instruments. We do a daily live session, where we guide our clients on the right side of the market. In addition, we have a chat room where our moderators will help you with any questions you have about what is happening in the market at the moment. You can try us for 14 days for only $9.99.
Back
