In today’s blog, we will have a look at the Seabridge Gold stock. The stock is listed in the SP 500.
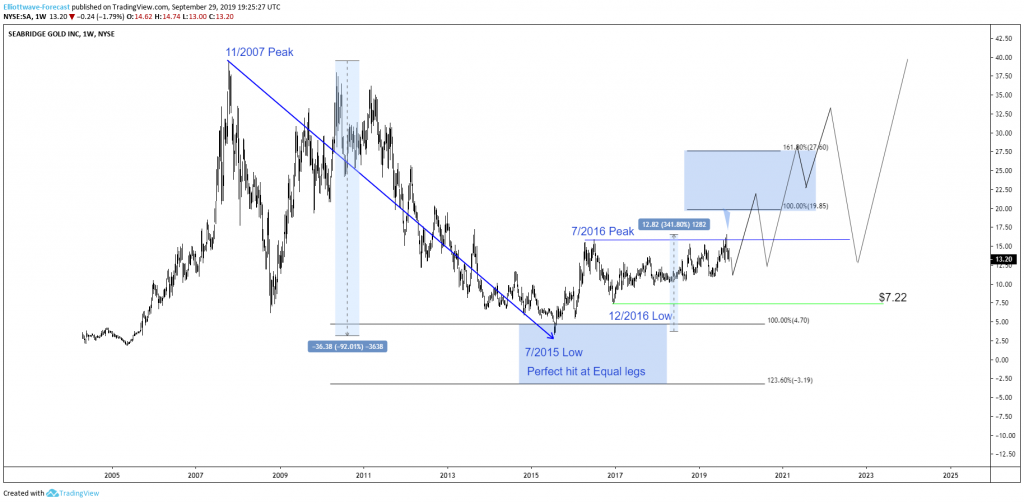
Seabridge Gold is a Canadian resource gold mining company headquartered in Toronto Ontario Canada. It was founded in 1979 as Copper Mines Ltd. Over the last years, the stock lost 91% of its value. Starting from November 2007 peak. The stock dropped to $3.45 low which marked in July 2015. From its 2007 peak ti reaches the equal legs towards 4.70 area and from there a bigger reaction higher in favor of the stock was expected to take place. It was a perfect equal leg hit. Above from 3.45, it managed to gain over 342% from (3.45 to around 16.79).
Let’s have a look at the weekly price action and what to expect for the company.
Seabridge Gold 09.29.2019 Weekly Chart
In the chart above you can see that the stock ended the cycle from 2007 peak at 2015 low. Above from there, Seabridge Gold has been showing strength. Below 2007 peak, it has been in the progress of correcting that in 3-7 or 11 swings. Recently, Seabridge Gold broke above 7/2016 peak opening up a higher high sequence. With that said, the stock has an incomplete sequence from 2015 low indicating that more upside towards 19.85-27.60.
Summarizing, the stock should see more upside in the next weeks into 19.85-27.60. Anyway, as you can see there should be strong in the next years. Of course, nothing runs in a straight line. There will be pullbacks, but those should be supported in the sequences of 3-7 or 11 swings.
We believe in cycles, distribution, and many other tools in addition to the classic or new Elliott wave Principle. To get a regular update on the market and Elliott wave charts in 4-time frames. And the best thing is you can join us for a 14 days FREE trial to see whether our service suits you.
If you enjoy this article, check our work and join HERE to see Elliott Wave Forecast in 4-time frames for 78 instruments as well as getting access to Live Trading Room, Live Session, and more.
Back


