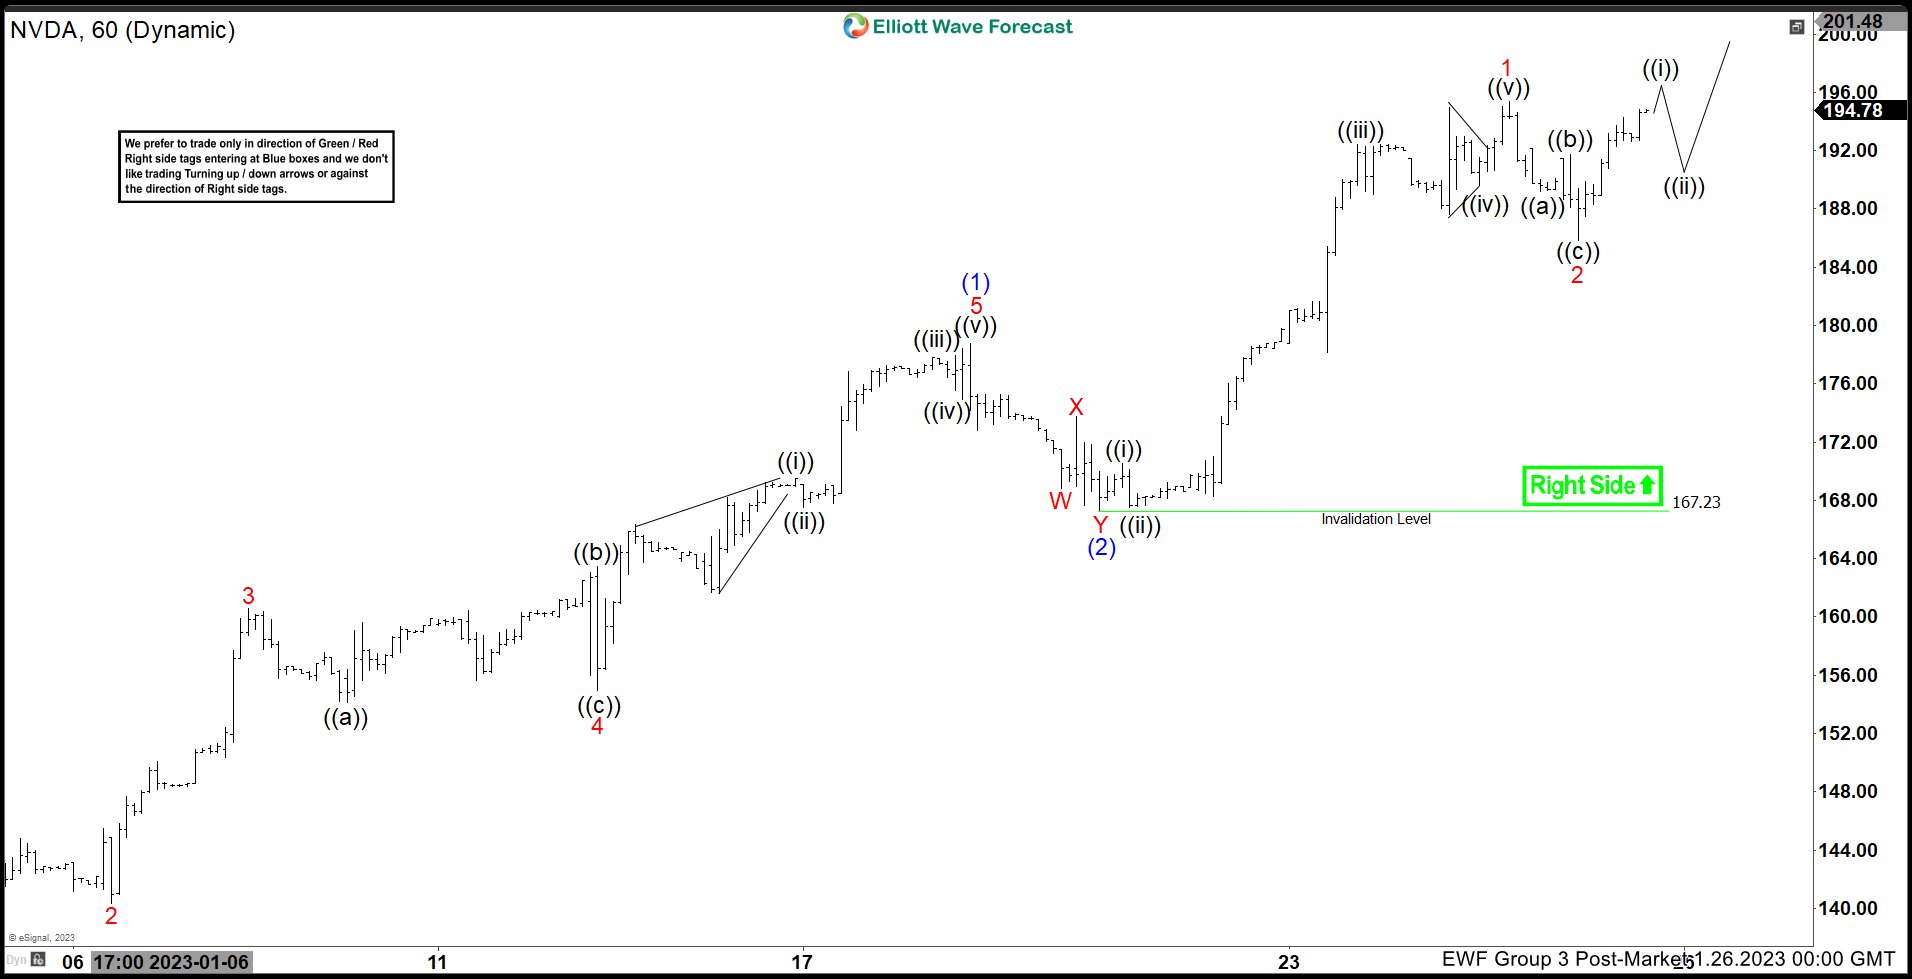
NVDA shows a bullish Elliott Wave sequence from 10.13.2022 low favoring further upside. A 100% – 161.8% Fibonacci extension target from 10.13.2022 low can see the stock rallying to 219 – 268. Near-term cycle from 12.28.2022 low is in progress as a 5 waves impulse Elliott Wave structure. Up from 12.28.2022 low, wave (1) ended at 178.73 with internal subdivision as another 5 waves in lesser degree. Up from 12.28.2022 low, wave 1 ended at 151 and pullback in wave 2 ended at 140.34. The stock extends higher again in wave 3 towards 160.56 and pullback in wave 4 ended at 154.92. Final leg higher wave 5 ended at 178.73 which completed wave (1).
Wave (2) pullback ended at 167.23 with internal subdivision as a double three. Down from wave (1), wave W ended at 168.80, wave X ended at 173.77, and final leg wave Y ended at 167.23 which completed wave (2). Stock then resumes higher in wave (3). Up from wave (2), wave 1 ended at 195.35 and pullback in wave 2 ended at 185.80. Near term, as far as pivot at 167.23 low stays intact, expect dips to find support in 3, 7, or 11 swing for further upside.


