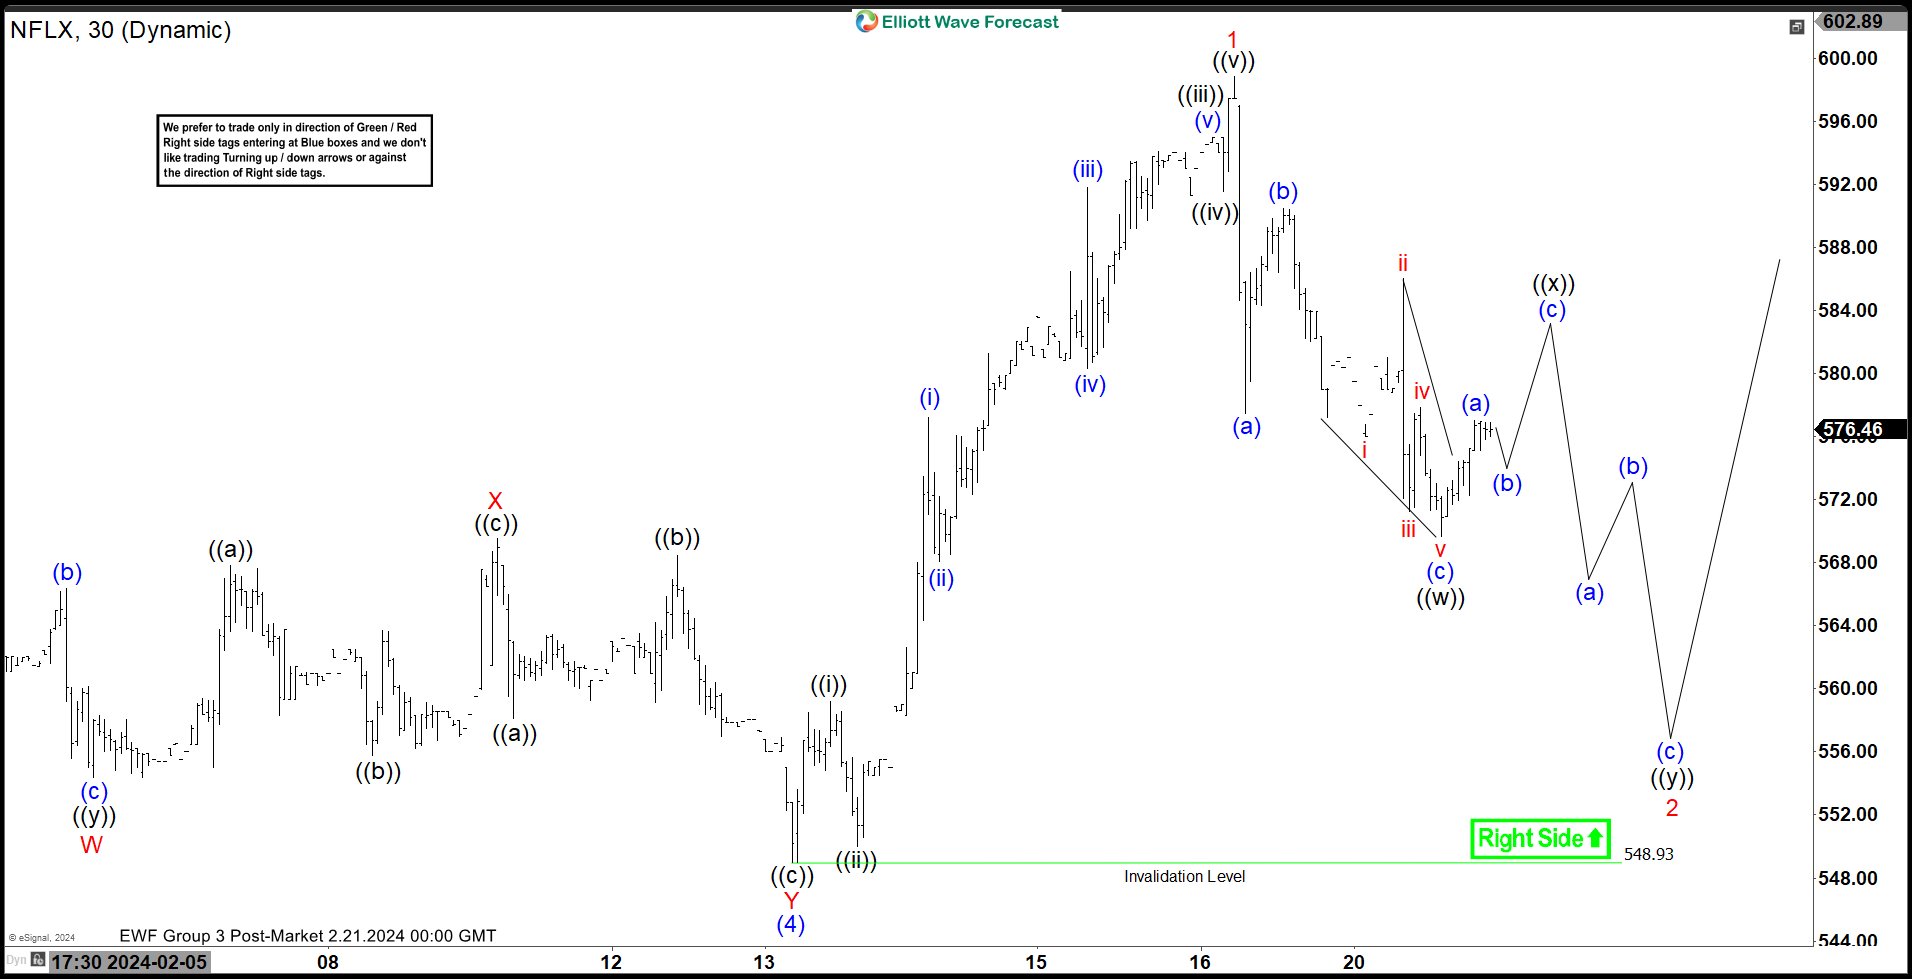
Short Term Elliott Wave View in Netflix (NFLX) suggests that cycle from 12.6.2023 low is in progress as a 5 waves impulse Elliott Wave structure. Up from 12.6.2023 low, wave (1) ended at 500.89 and wave (2) dips ended at 461.86. The stock extended higher in wave (3) towards 579.64 and pullback in wave (4) ended at 548.93 as the 30 minutes chart below shows. Internal subdivision of wave (4) unfolded as a double three. Wave W ended at 554.37 and wave X ended at 589.50. Wave Y lower ended at 548.93 which completed wave (4).
The stock has turned higher in wave (5). Up from wave (4), wave ((i)) ended at 559.20 and dip sin wave ((ii)) ended at 550. Wave ((iii)) higher ended at 594.99 and pullback in wave ((iv)) ended at 591.53. Final leg wave ((v)) ended at 598.80 which completed wave 1 in higher degree. Pullback in wave 2 is now in progress. Down from wave 1, wave (a) ended at 577.46 and rally in wave (b) ended at 590.42. Wave (c) lower ended at 569.66 which completed wave ((w)). Expect rally in wave ((x)) to fail and the stock to turn lower in wave ((y)) before ending wave 2. As far as pivot at 548.91 low stays intact, pullback should continue to find support in 3, 7, 11 swing for further upside.


