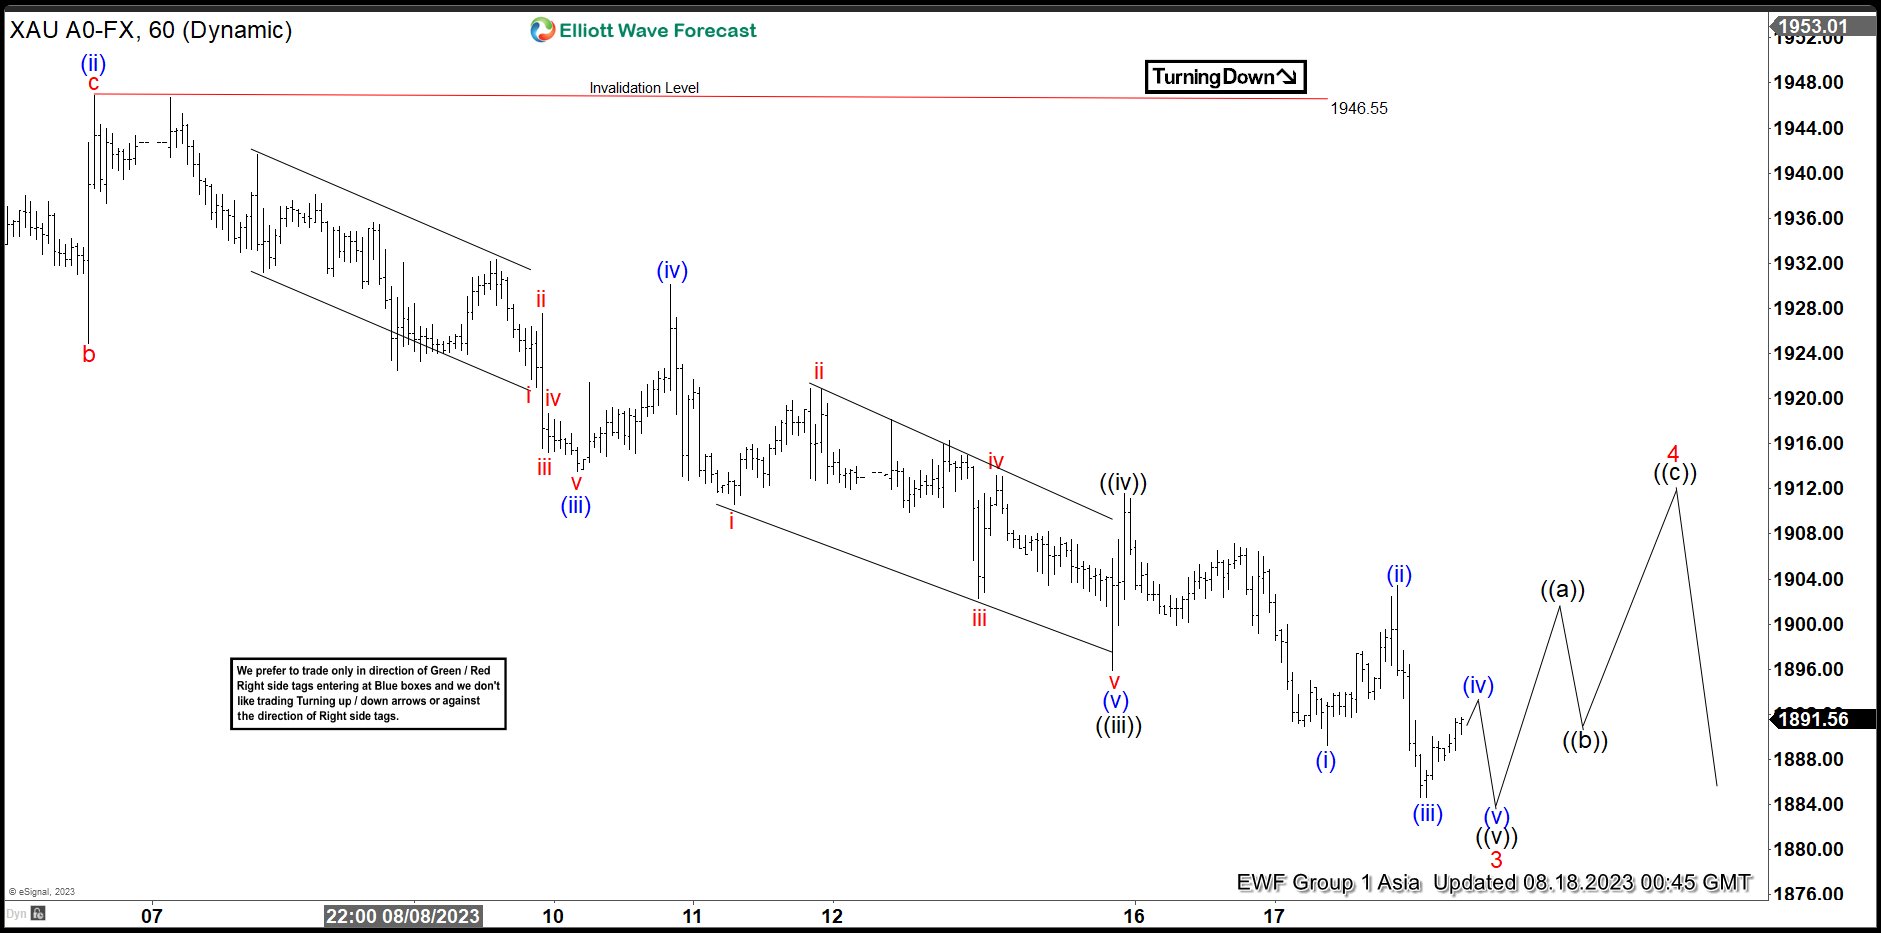
Short Term Elliott Wave structure in Gold (XAUUSD) suggests the rally in Gold on 7.27.2023 high ended wave 2. The metal now extends lower in wave 3 a 5 waves impulse. Down from 7.27.2023 high, wave ((i)) ended at 1942.1 and wave ((ii)) rally ended at 1972.35. Down from wave ((ii)), wave (i) ended at 1929.2 and wave (ii) ended at 1946.55. The 1 hour chart below shows the starting point of wave (ii) of ((iii)). From there, the metal extended lower in wave (iii) towards 1913.51 and wave (iv) ended at 1930.15. Final leg wave (v) ended at 1895.90 which completed wave ((iii)). Rally in wave ((iv))) ended at 1911.59.
Expect the metal to end wave ((v)) of 3 soon with another leg lower, then it should rally in wave 4 to correct cycle from 7.27.2023 high before it resumes lower. Near term, as far as pivot at 1946.55 high stays intact, expect rally to fail in 3 or 7 swing for further downside. Potential target lower is 100% – 161.8% Fibonacci extension from 5.4.2023 high which comes at 1685 – 1800. From this area, buyers can appear for at least 3 waves rally.

