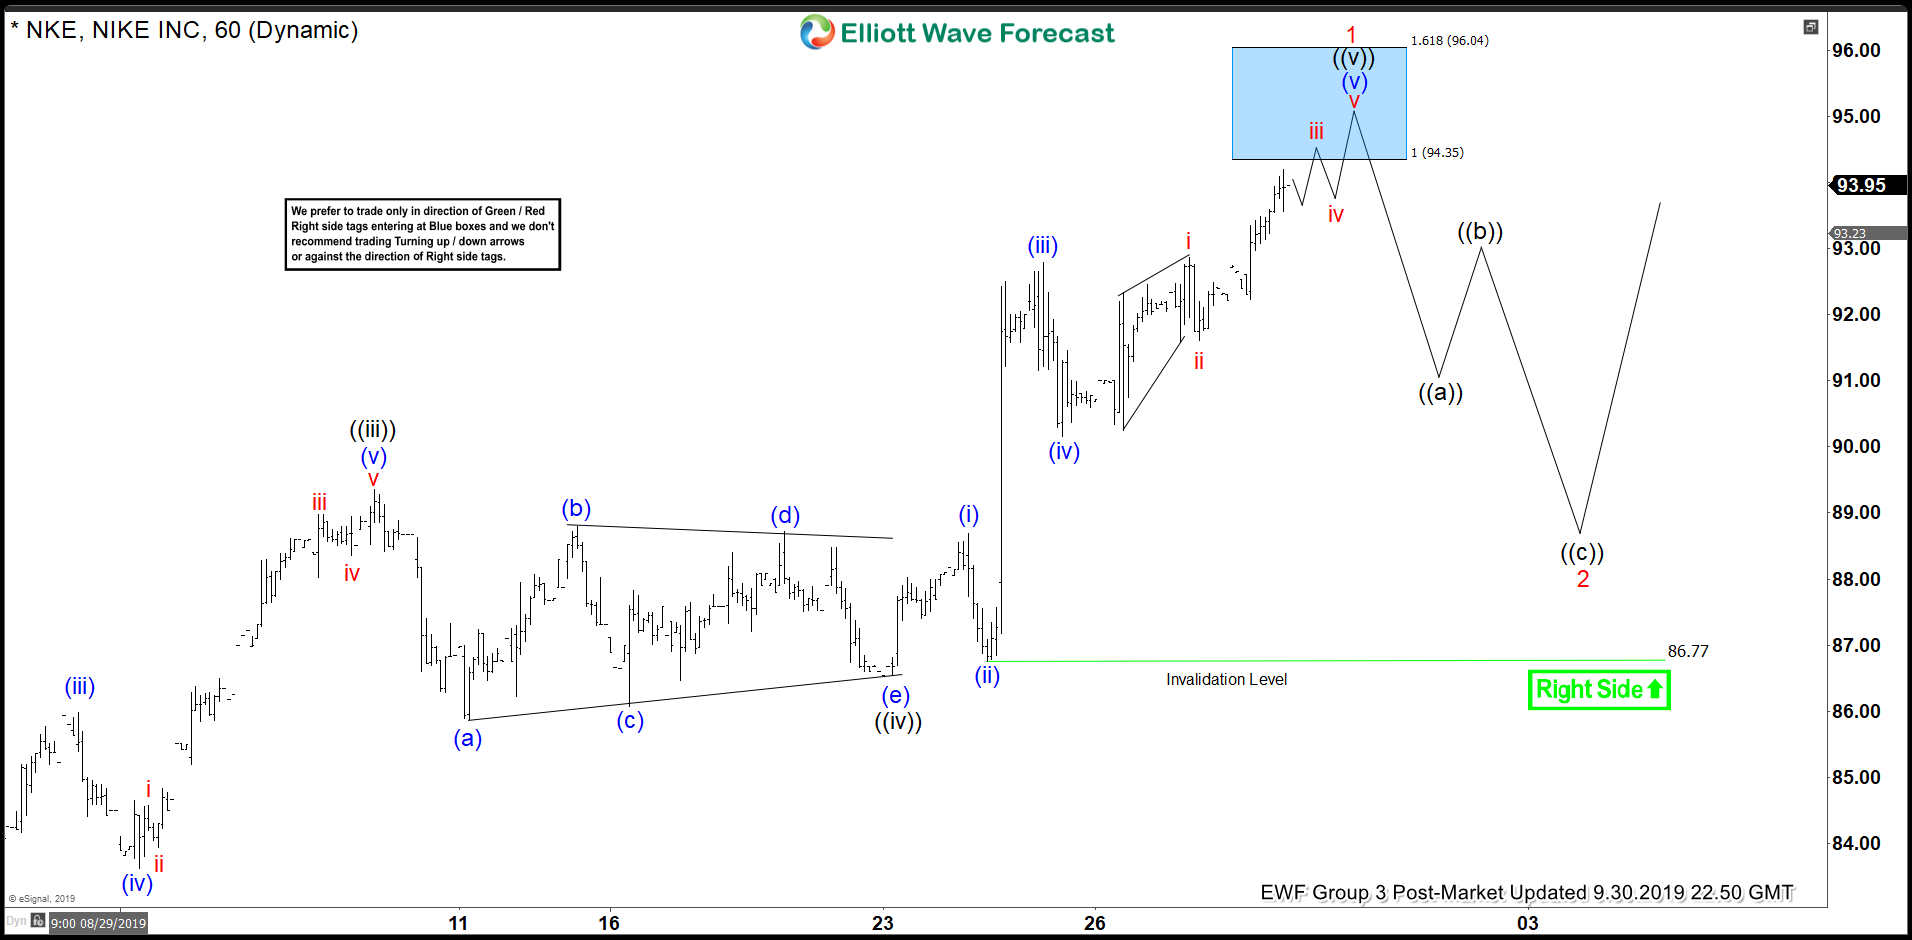
Short term Elliott Wave view on Nike (ticker: NKE) is calling the rally from August 5, 2019 low (78.19) as a 5 waves impulse Elliott Wave structure. The chart below shows wave ((iii)) of the impulse ended at 89.35, and wave ((iv)) pullback ended at 86.54 as a symmetrical triangle. The stock then extended higher in wave ((v)) with internal as an impulse of lesser degree. The entire 5 waves rally is expected to complete at 94.35 – 96.04 and this should also end wave 1 in higher degree.
The stock should then pullback in wave 2 to correct the entire rally from August 5 low before it resumes higher. Wave 2 pullback should unfold in 3, 7, or 11 swing with the key level on August 5 low (78.19). As far as pivot at 78.19 low stays intact during wave 2 pullback, we favor the stock to extend higher. We do not like selling the stock. Potential target to the upside is 100% Fibonacci extension area from Dec 20, 2018 low which comes at 100.4 – 105.9.
NKE 1 Hour Elliott Wave Chart


