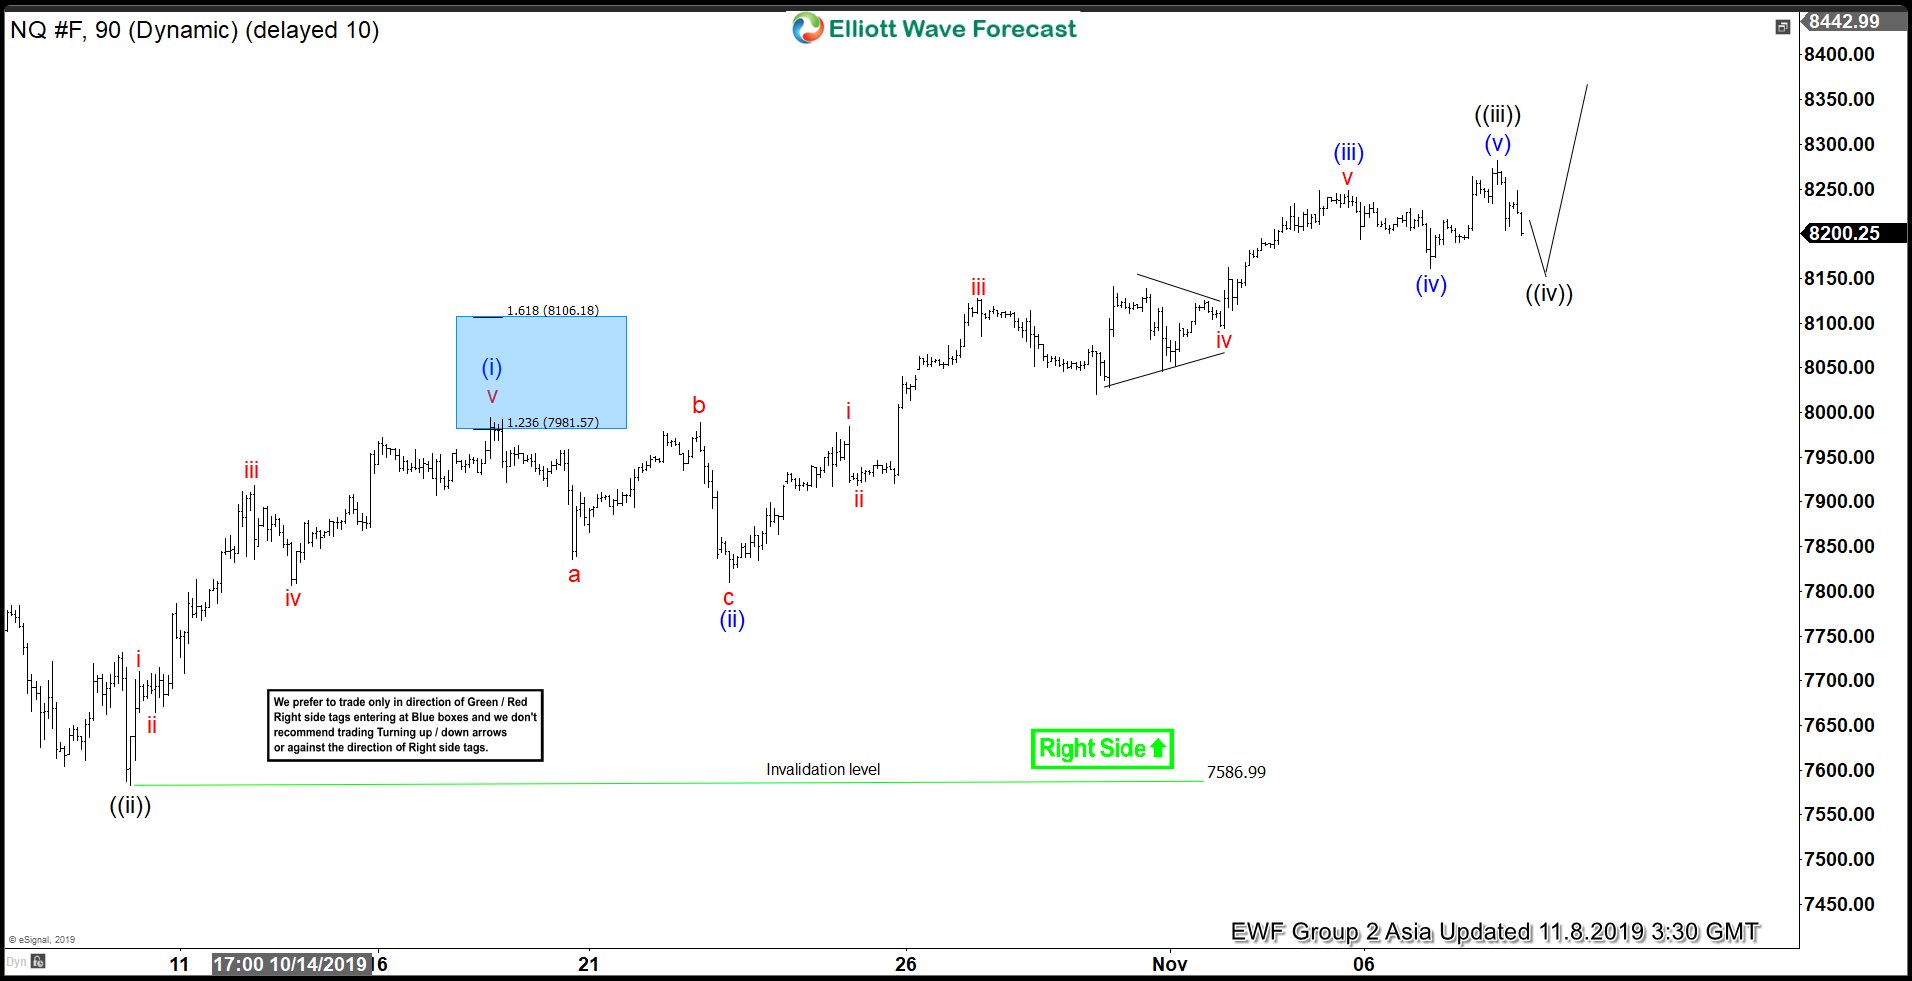
Short Term Elliott Wave View on Nasdaq Futures (NQ_F) shows 5 waves impulsive Elliott Wave rally from October 3, 2019 low. On the chart below, we can see the pullback to 7586.99 ended wave ((ii)). The Index has resumed higher and wave ((iii)) has completed at 8282.25. Subdivision of wave ((iii)) unfolded as 5 waves impulse in lesser degree. Up from 7586.99, wave (i) ended at 7994.75 and wave (ii) pullback ended at 7810.25. Index then resumed higher in wave (iii) towards 8248, and wave (iv) pullback ended at 8161. The final leg wave (v) of ((iii)) ended at 8282.25. Wave ((iv)) pullback is in progress in 3, 7, or 11 swing before the rally resumes. We don’t like selling the Index. As far as pivot at 7586.99 stays intact, expect dips to find support in the sequence of 3, 7, or 11 swing for further upside.
NQ_F 1 Hour Elliott Wave Chart