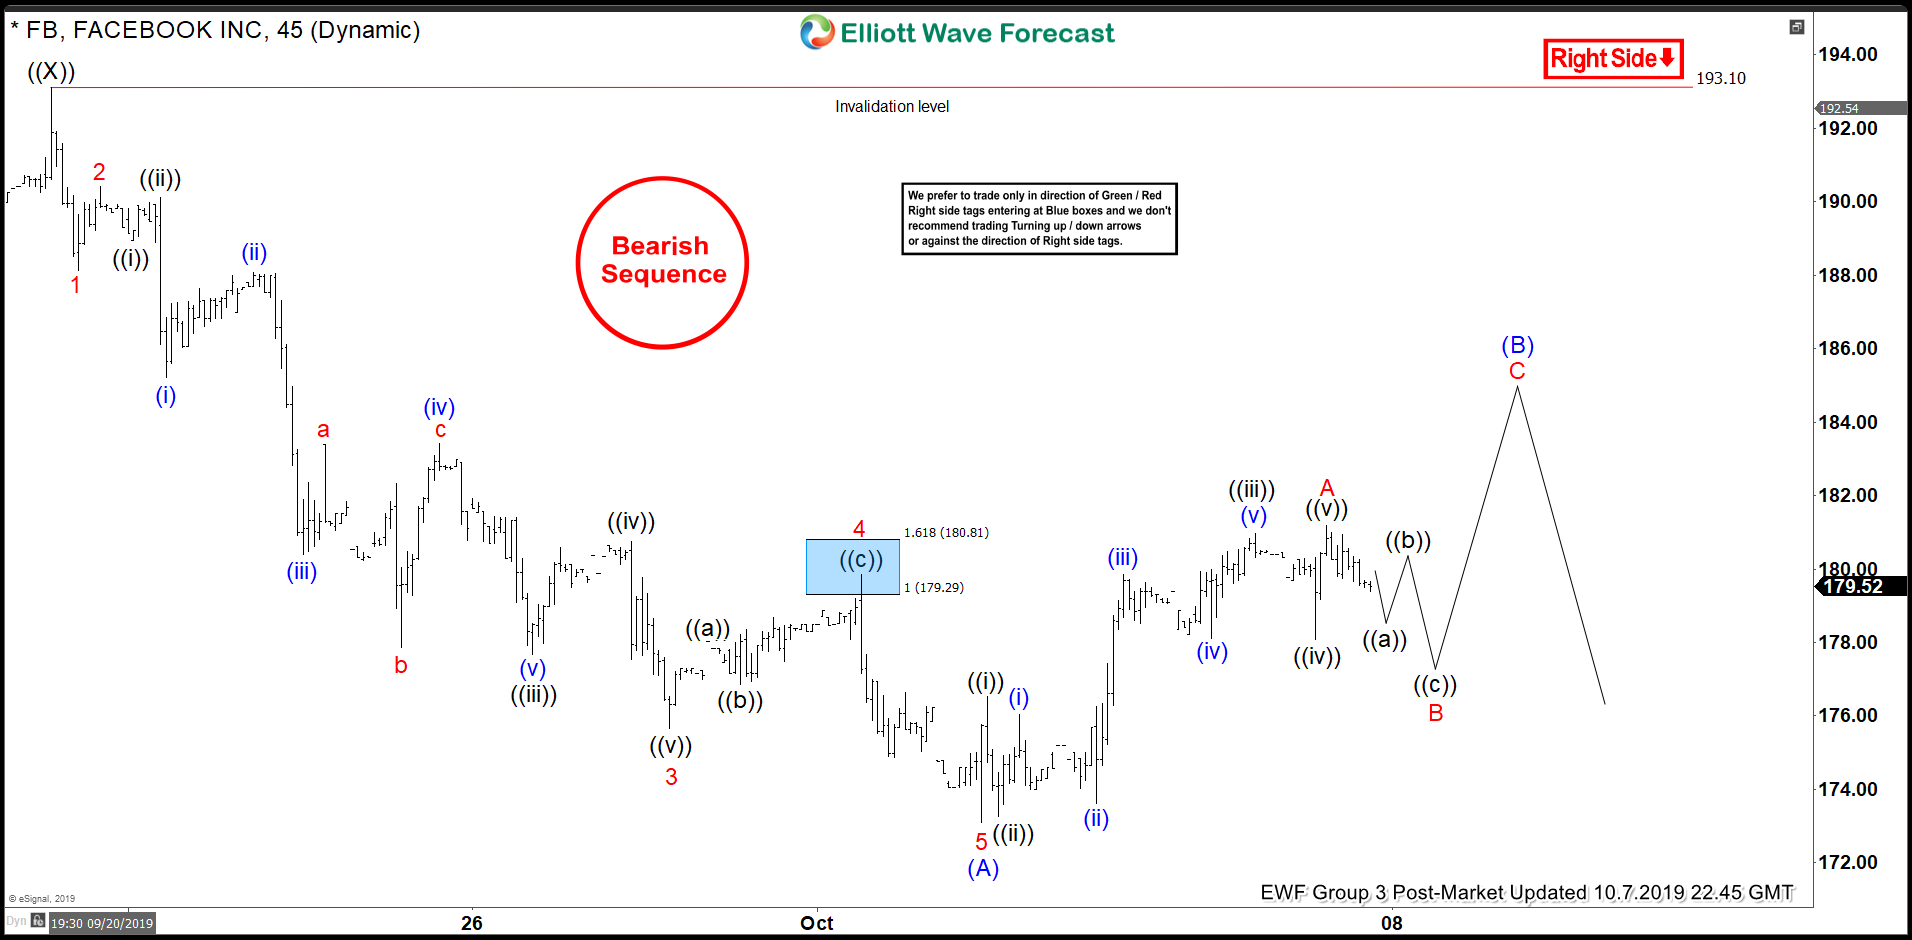
Short term Elliott Wave view on Facebook (ticker: FB) suggests the rally to 193. ended wave ((X)). The stock has resumed lower within wave ((Y)) which is unfolding as a zigzag Elliott Wave structure. Down from 193.1, wave (A) of the zigzag ended at 173.09. Internal subdivision of wave (A) unfolded as 5 waves where wave 1 ended at 188.12, and wave 2 bounce ended at 190.41. Stock resumed lower in wave 3 towards 175.66, wave 4 bounce ended at 179.84, and wave 5 of (A) ended at 173.09.
Wave (B) bounce is currently in progress to correct the cycle from Sept 20 high in 3, 7, or 11 swing before the decline resumes again. Internal of wave (B) is unfolding as zigzag of lesser degree where wave A of (B) ended at 181.18. Expect a pullback in wave B, then another leg higher in wave C to end wave (B). Afterwards, as far as pivot at 193.1 high stays intact, Facebook should extend lower. Potential target to the downside can be as low as 100% Fibonacci extension from July 25, 2019 high towards $143.4 – 152.9.
Facebook (FB) 1 Hour Elliott Wave Chart


