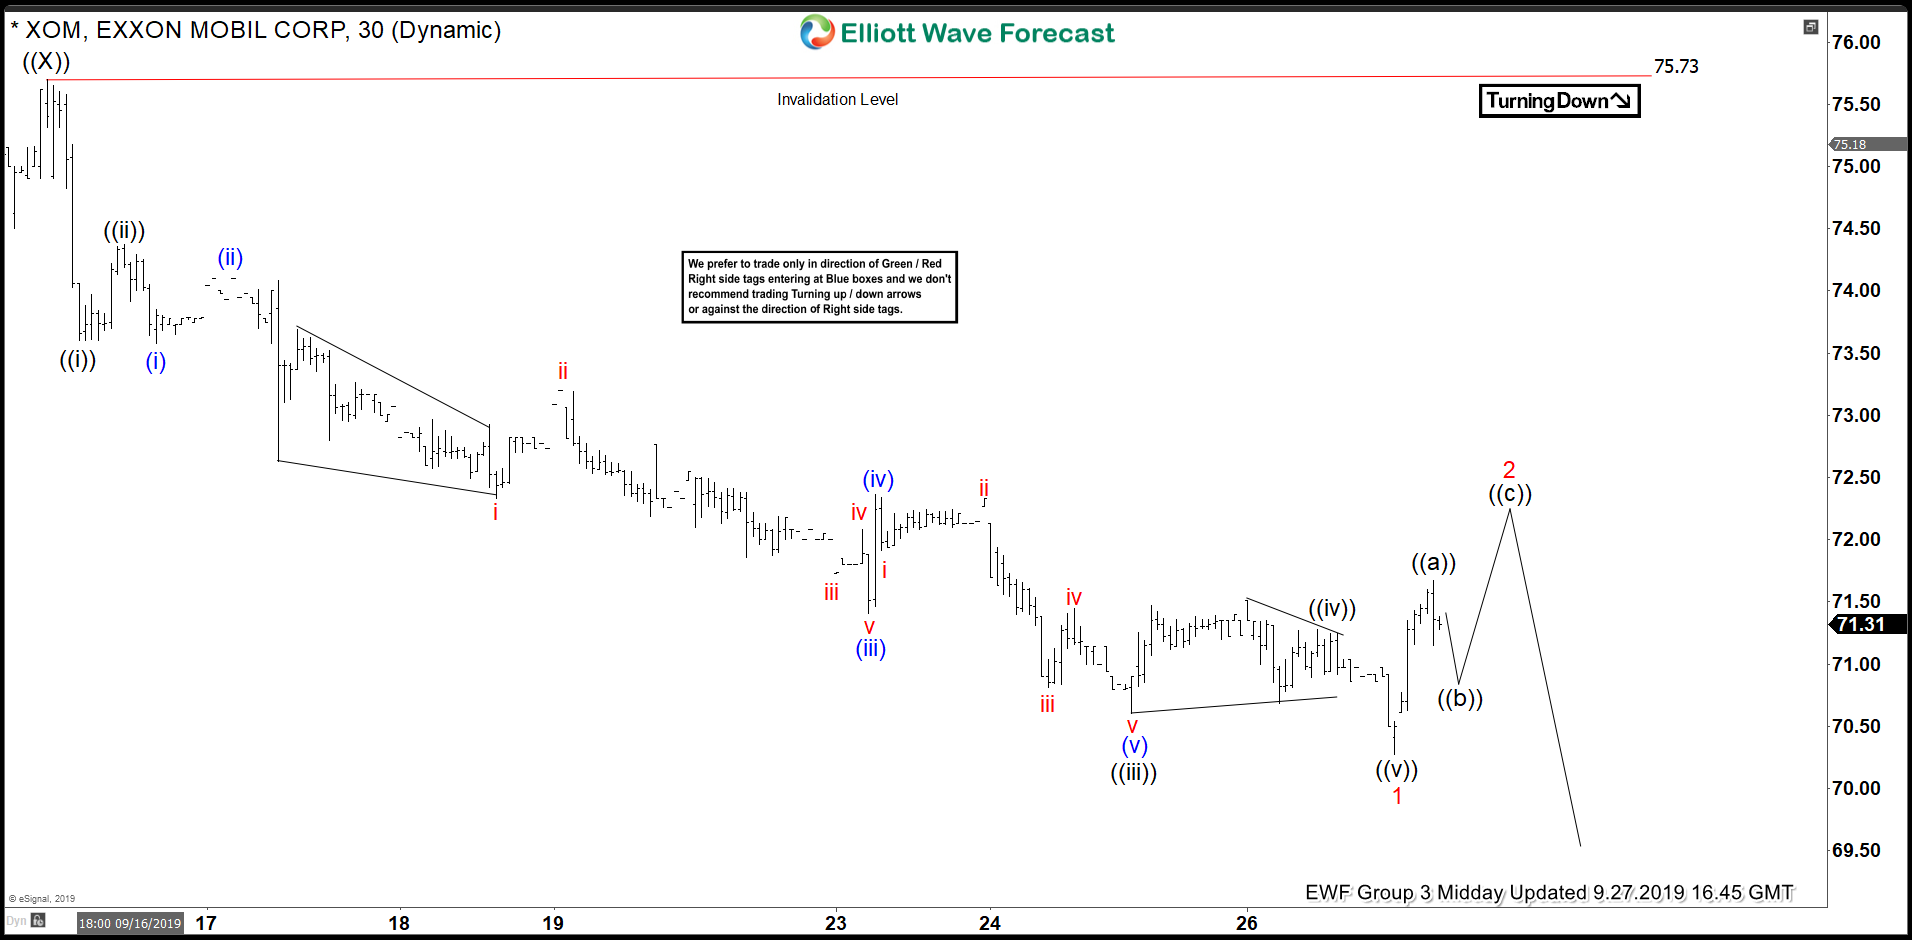
Short term Elliott Wave view on Exxon Mobil (ticker: XOM) suggests the rally to 75.68 on September 16, 2019 high ended wave ((X)). The stock has turned lower and the structure of the decline unfolded as a 5 waves impulse Elliott Wave structure. Down from 75.68, wave ((i)) ended at 73.6 and bounce to 74.37 ended wave ((ii)). The stock then resumed lower in wave ((iii)) towards 70.81 as another 5 waves in lesser degree. This is classic example of Elliott Wave structure with extended wave ((iii)).
Wave ((iv)) bounce ended at 71.44, and wave ((v)) finally ended at 70.6. The 5 waves move lower completed wave 1 in higher degree. The stock now is in wave 2 bounce to correct the cycle from September 16 high in 3, 7, or 11 swing before the decline resumes. As far as pivot at 75.68 high stays intact during the bounce, expect rally to fail and stock to extend lower again. If the stock instead breaks below 70.6, then it suggests that wave ((v)) of 1 remains in progress. In that case, it should still bounce in wave 2 again from lower levels to correct cycle from September 16 high before the decline resumes.
XOM 1 Hour Elliott Wave Chart

