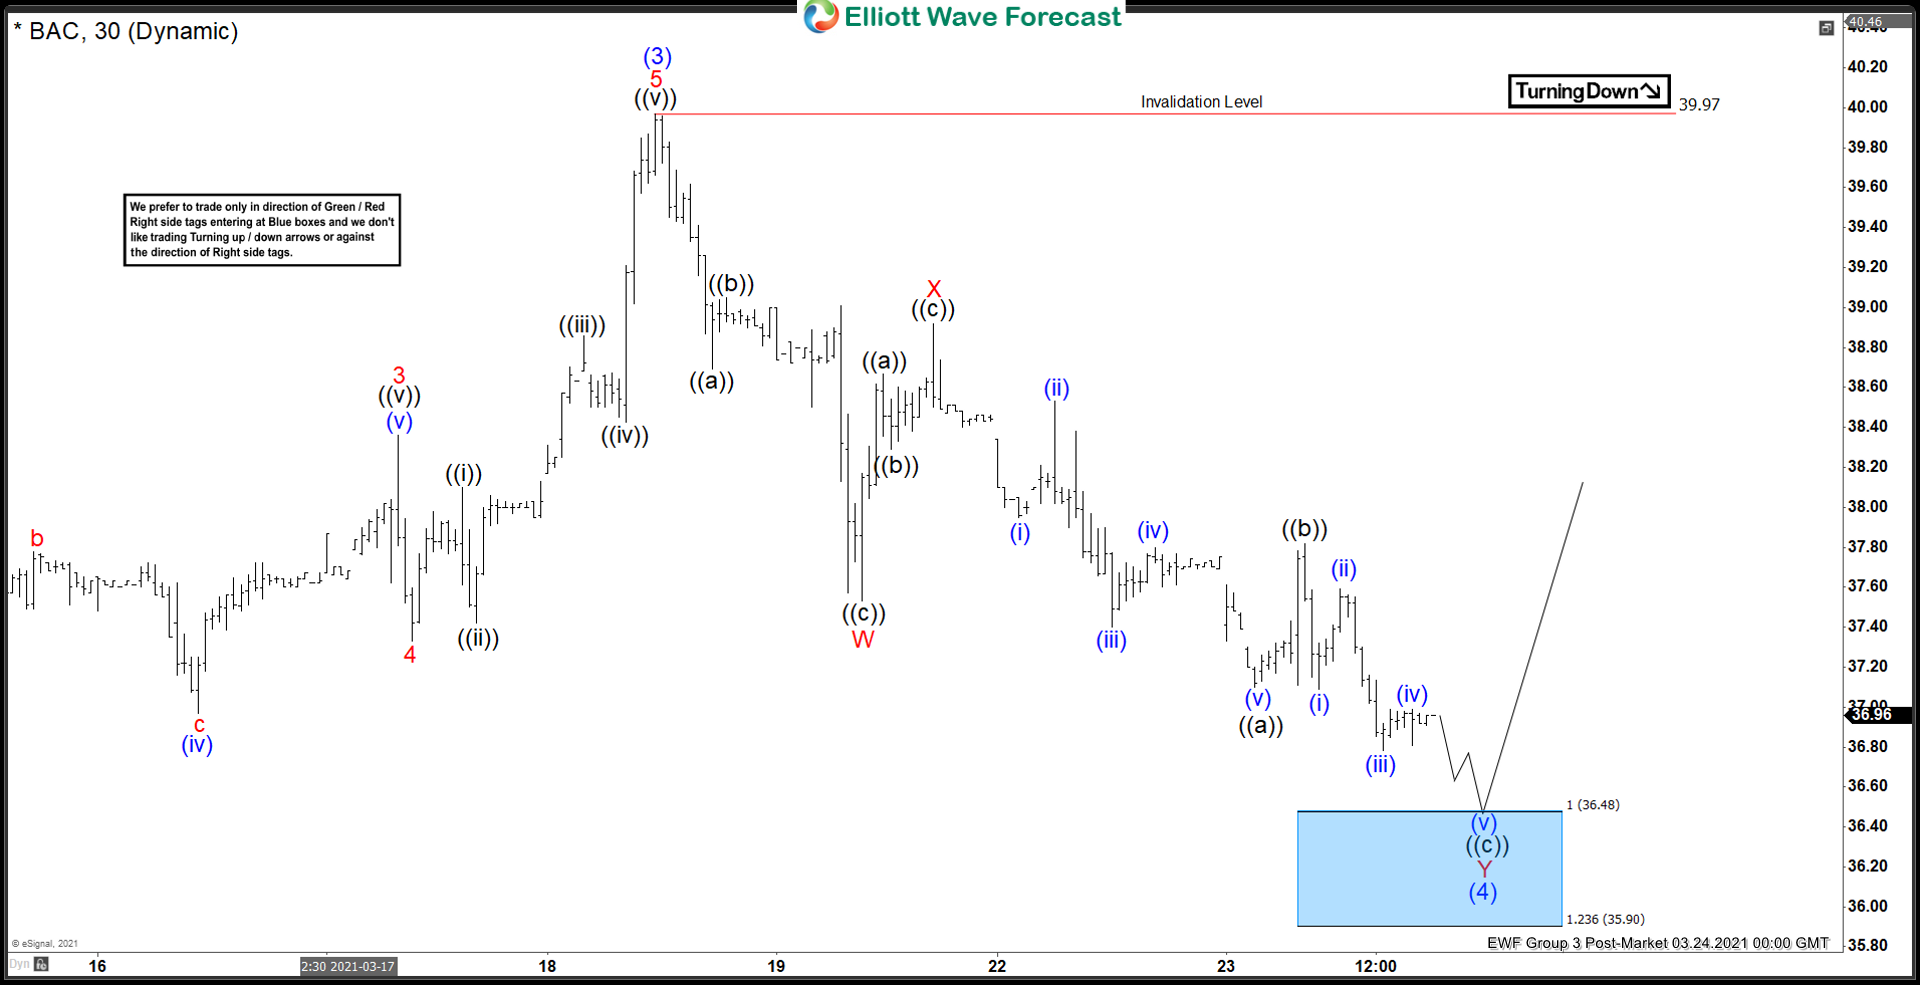
Short term Elliott Wave View suggests that the rally from September 25 low is unfolding as a 5 waves impulsive Elliott Wave structure. 30 minutes chart below shows wave (3) of this impulsive structure ended at 39.97. Wave (4) pullback is currently in progress as a double three Elliott Wave structure. Down from wave (3) high, wave ((a)) ended at 38.69 and bounce in wave ((b)) ended at 39.05. Final leg lower wave ((c)) ended at 37.53 and this completed wave W in higher degree. Wave X rally then ended at 38.92 as a zigzag structure.
The stock has resumed lower in wave Y with subdivision unfolding as a zigzag structure. Down from wave X high, wave (i) ended at 37.95 and rally in wave (ii) ended at 38.53. Stock then resumed lower in wave (iii) towards 37.40, wave (iv) ended at 37.80, and wave (v) of ((a)) ended at 37.10. Bounce in wave ((b)) ended at 37.82 and the stock has resumed lower in wave ((c)) of Y. Expect Bank of America to find support when it reaches the 100% – 161.8% Fibonacci extension from March 18. This area comes at 35 – 36.48 and 3 waves rally at least can happen from here.


