Apple ( AAPL ) shows incomplete bearish sequence from 12.26.2024 peak and looking for further downside. Down from 12.26.2024 peak, wave ((A)) ended at 218.06 and wave ((B)) ended at 250. Wave ((C)) lower is in progress as a 5 waves impulse Elliott Wave structure. Down from wave ((B)), wave (1) ended at 230.2 and wave (2) ended at 244.03 as the 30 minutes chart below shows.
Wave (3) is in progress with internal subdivision as another impulse in lesser degree. Down from wave (2), wave 1 ended at 229.23 Rally in wave 2 unfolded as a zigzag structure. Up from wave 1, wave ((a)) ended at 237.86, wave ((b)) ended at 233.33, and wave ((c)) ended at 241.36 which completed wave 2.
The stock has resumed lower in wave 3 lower. Down from wave 2, wave ((i)) ended at 235.25 and wave ((ii)) ended at 238.47. Wave ((iii)) lower ended at 224.22 and wave ((iv)) rally ended at 228.66. Final leg wave ((v)) ended at 217.46 which completed wave 3 in higher degree. Rally in wave 4 ended at 223.28.
Expect wave 5 to end soon which should complete wave (3) in higher degree. Then it should rally in wave (4) to correct cycle from 3.3.2025 peak before it resumes lower. Near term, as far as pivot at 241.36 high stays intact, expect rally to fail in 3, 7, or 11 swing for more downside.
AAPL 30-Minute Elliott Wave Technical Analysis
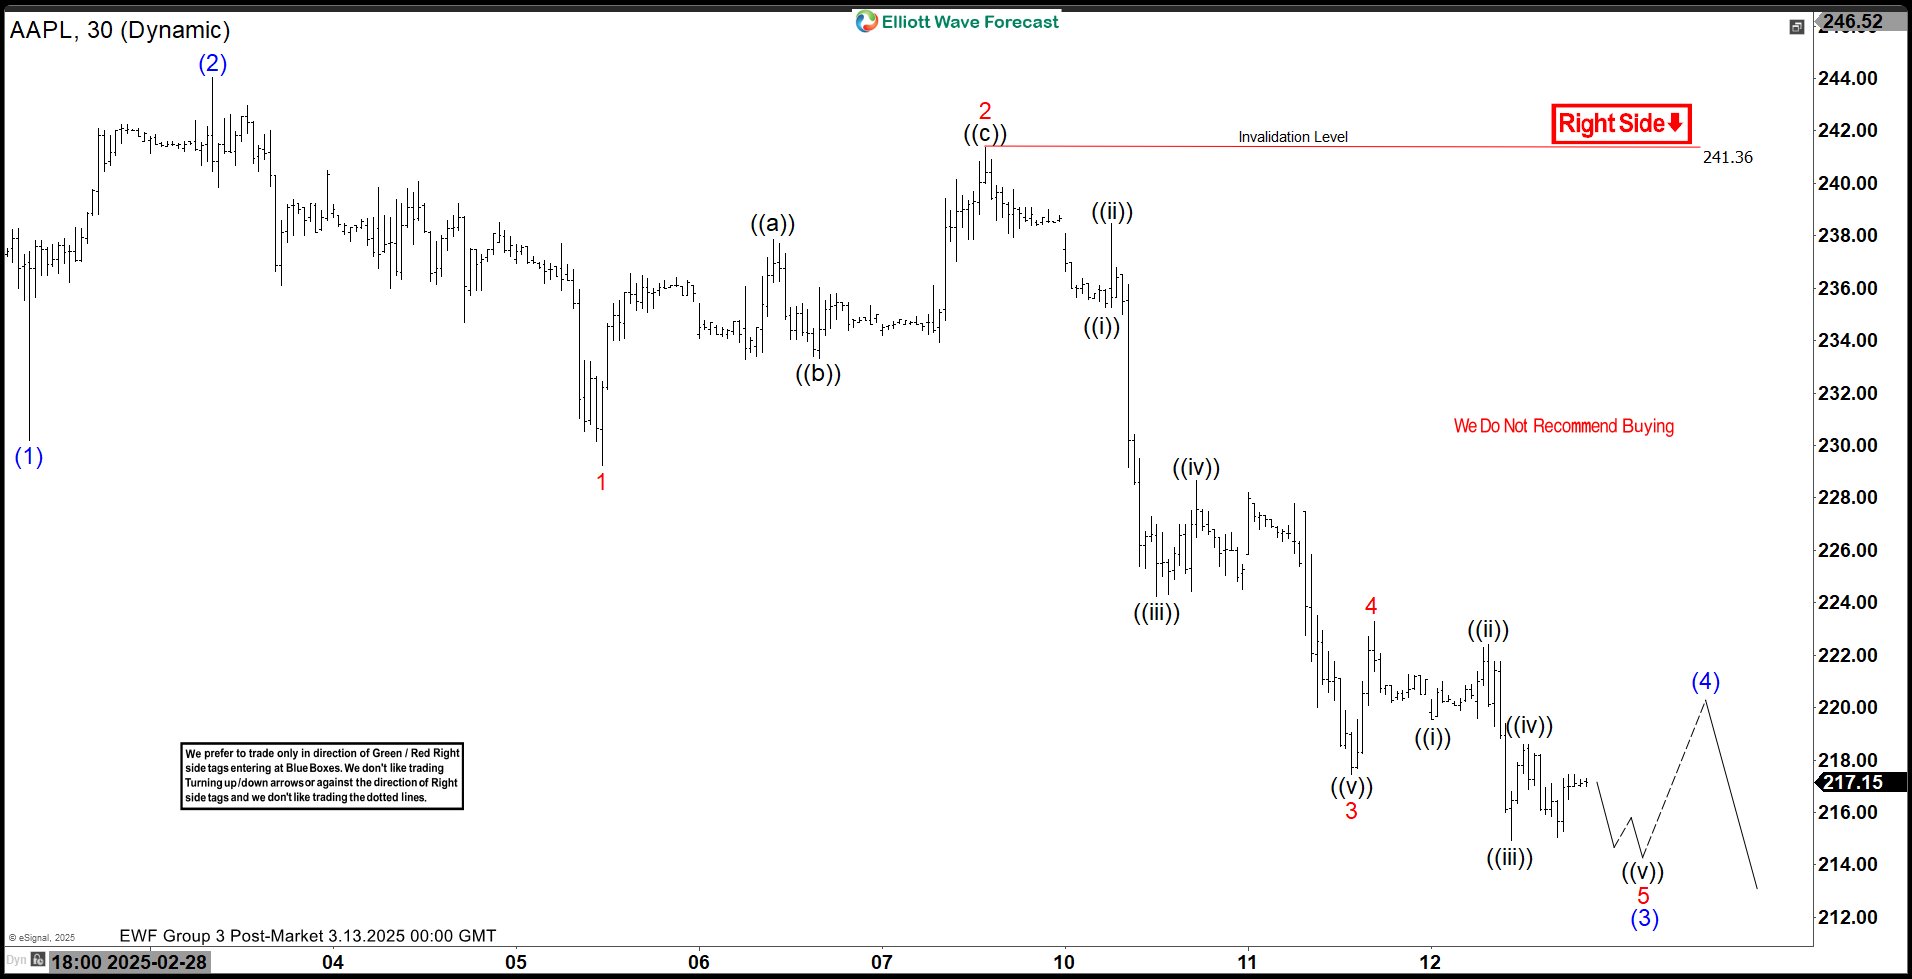
AAPL 30-minute chart showing current bearish wave structure and key levels
Video Analysis: Apple (AAPL) Elliott Wave Pattern
Detailed video analysis of AAPL’s current Elliott Wave structure
Key Takeaways for AAPL Traders
The current Elliott Wave structure suggests:
1. The bearish sequence from December 2024 peak remains incomplete
2. Wave ((C)) is unfolding as a 5-wave impulse pattern
3. Critical resistance remains at 241.36 high
4. Expect wave (3) completion followed by wave (4) correction
5. Final wave (5) down should complete the bearish sequence
Traders should monitor these key levels and wave patterns for potential trading opportunities in Apple stock.
