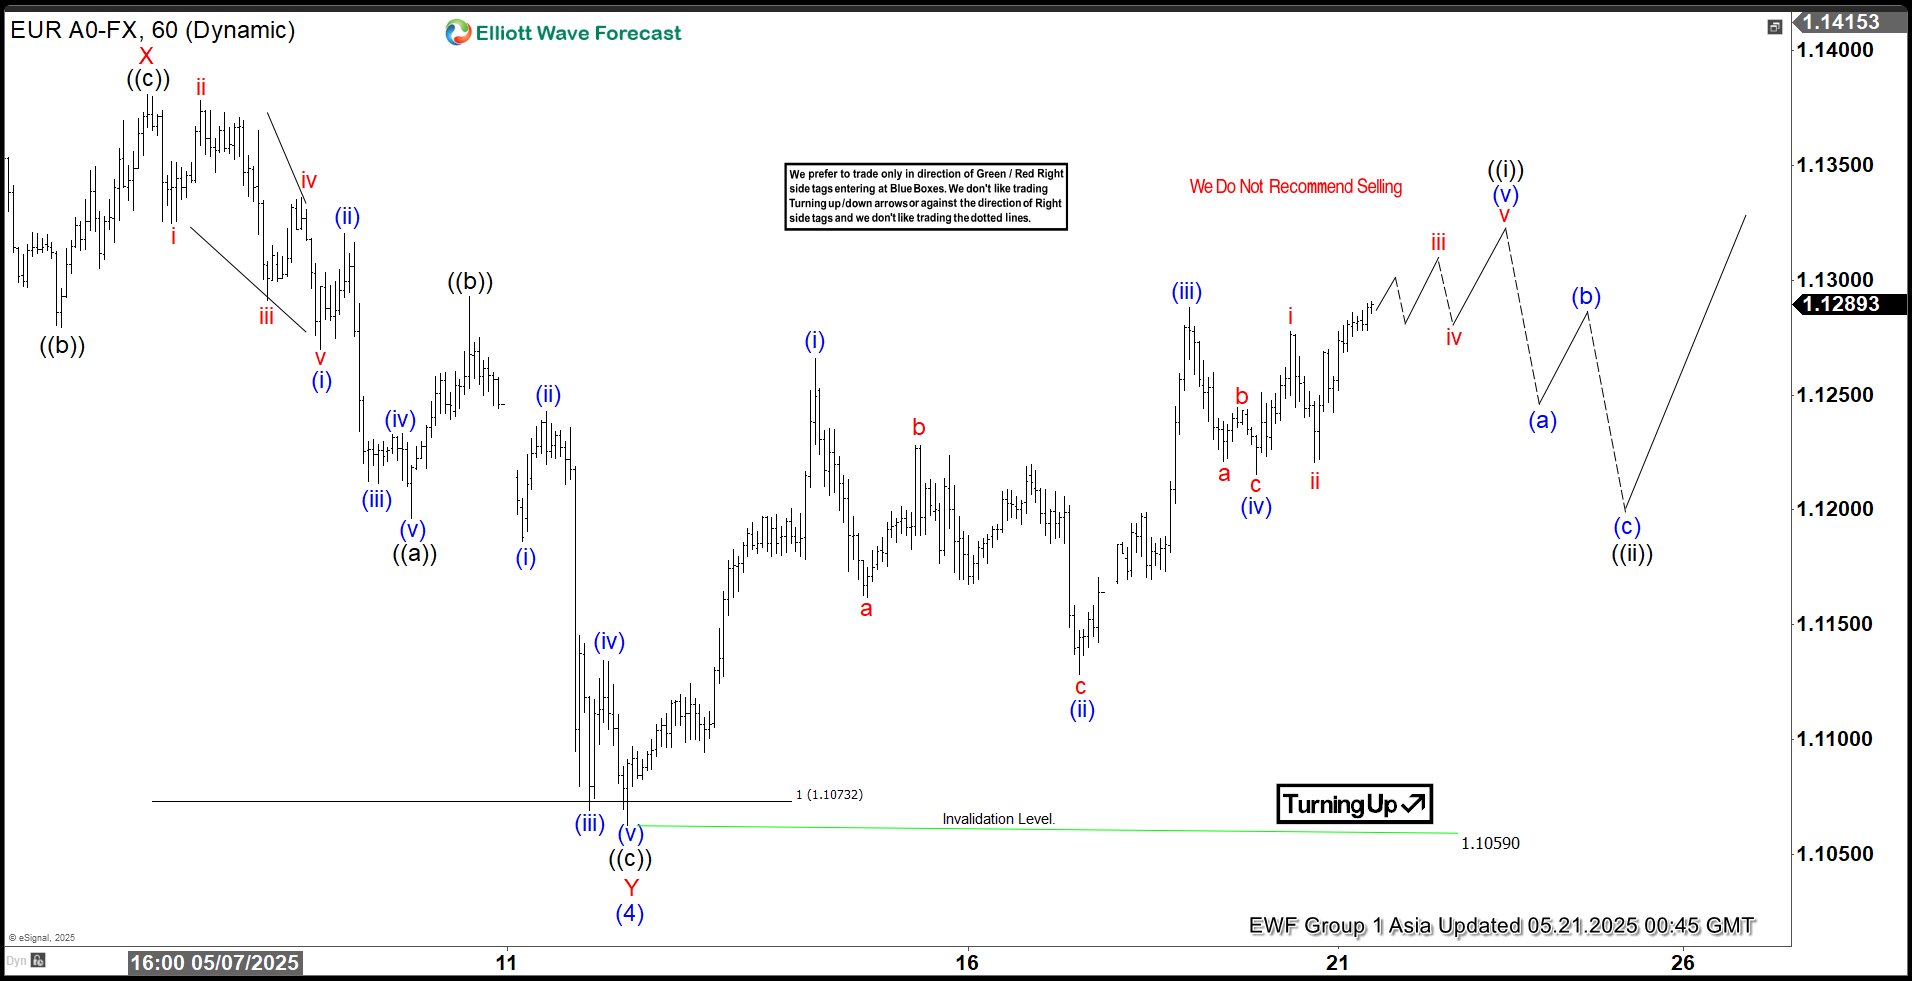
The short-term Elliott Wave analysis for EURUSD indicates that the correction from the April 21, 2025, high has concluded with wave (4) at 1.1059. From the wave (3) peak, the decline unfolded as follows: wave W ended at 1.1265, wave X at 1.1381, and wave Y, structured as a zigzag, completed at 1.1059. Within wave Y, wave ((a)) reached 1.1196 and wave ((b)) hit 1.1292. Wave ((c)) lower concluded at 1.106, finalizing wave Y of (4). The pair has since turned upward in wave (5).
From the wave (4) low, the rally in wave ((i)) is developing as a five-wave diagonal pattern. Wave (i) peaked at 1.1265, followed by a pullback in wave (ii) to 1.1128. Then wave (iii) advanced to 1.1288, and wave (iv) retraced to 1.1215. Wave (v) is expected to conclude soon, completing wave ((i)) in a higher degree. Subsequently, a pullback in wave ((ii)) should correct the cycle from the May 13, 2025, low before the pair resumes its upward trend. As long as the 1.106 pivot low holds, any near-term pullback is likely to attract buyers in a 3, 7, or 11-swing pattern, supporting further upside.
EURUSD 60-Minute Elliott Wave Technical Chart