EURJPY has rallied 1300+ pips during three weeks of March. It found a low at 124.39 on March 7, 2022 and reached a high of 137.54 on March 28, 2022. This equates to 10.57% gain within just three weeks. It seems to have ended a cycle from March 7, 2022 low and pulling back. In today’s article, we will present the future path and also look at some charts from the recent past in which we showed the path to our members.
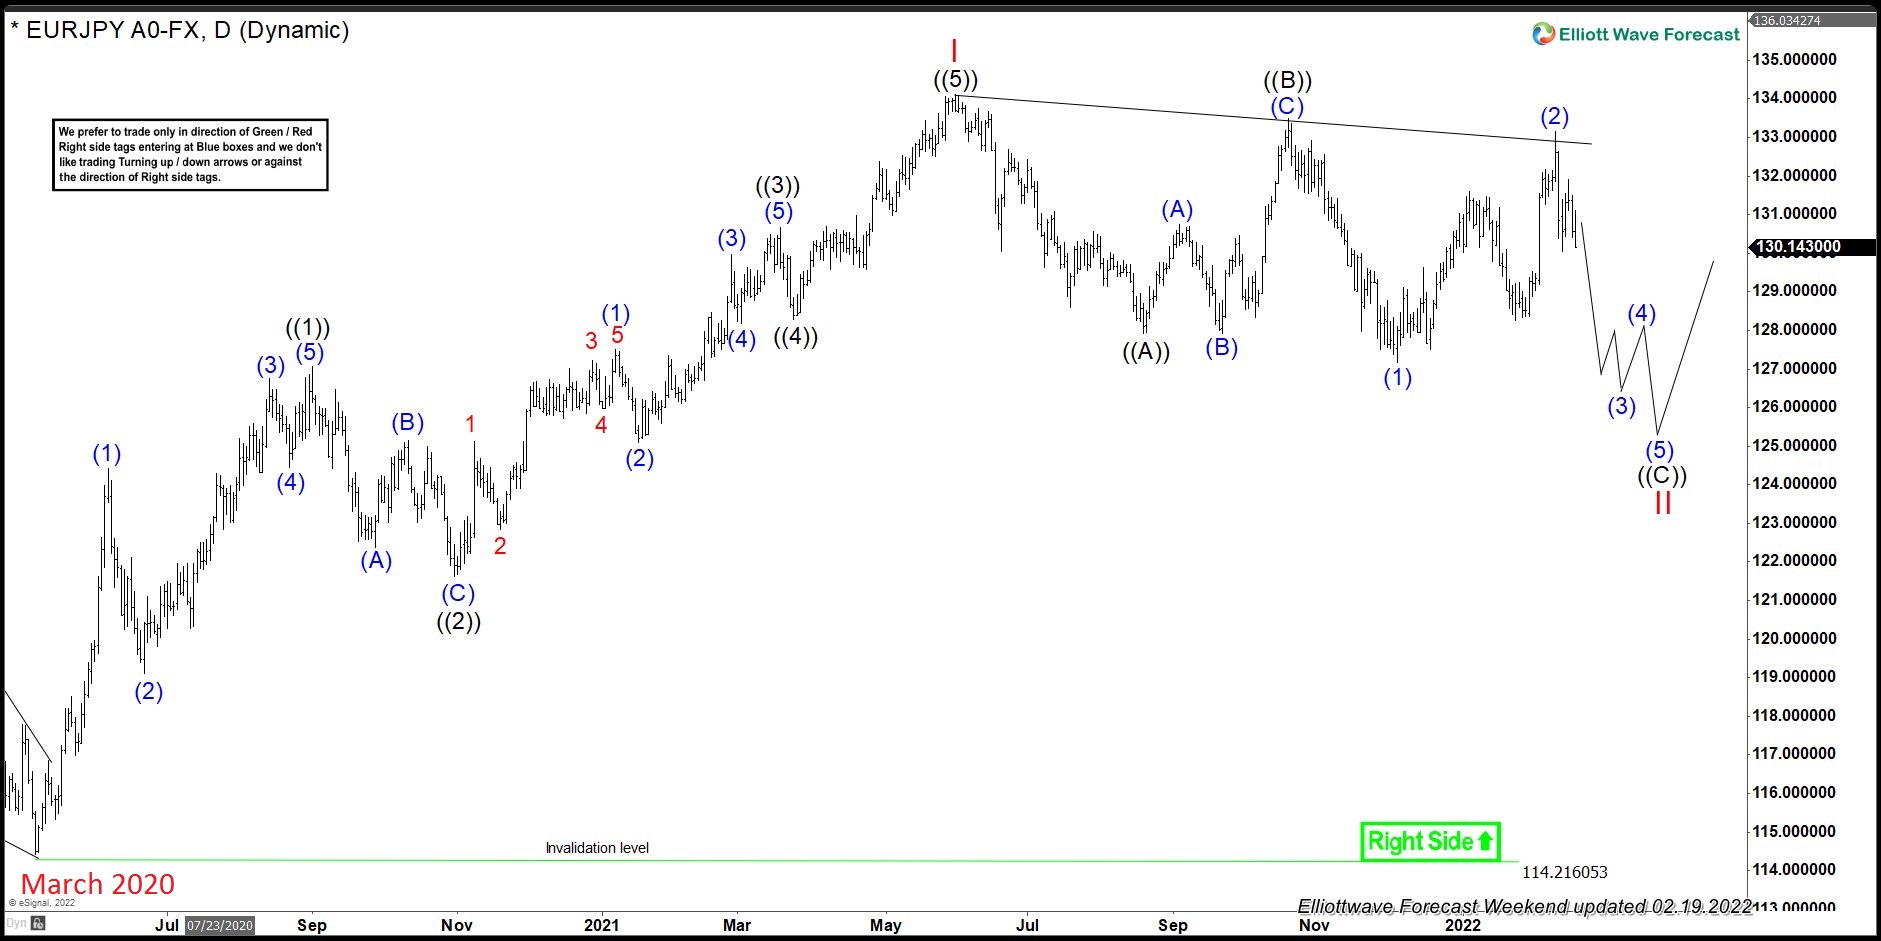
EURJPY Elliott Wave Analysis – Daily Time Frame – 19 February 2022
Chart below shows EURJPY cycle from March 2020 low ended at 134.12 on June 1, 2021. We labelled this rally as an Elliott wave impulse which has been nicely sub-divided into 5 waves. Following this peak, pair started a pull back to correct the cycle from March 2020 low. We can already see 3 waves down but based in market correlation, we expected the pair to see more downside and break below December 2021 low to complete the correction of May 2020 cycle before resuming the rally.
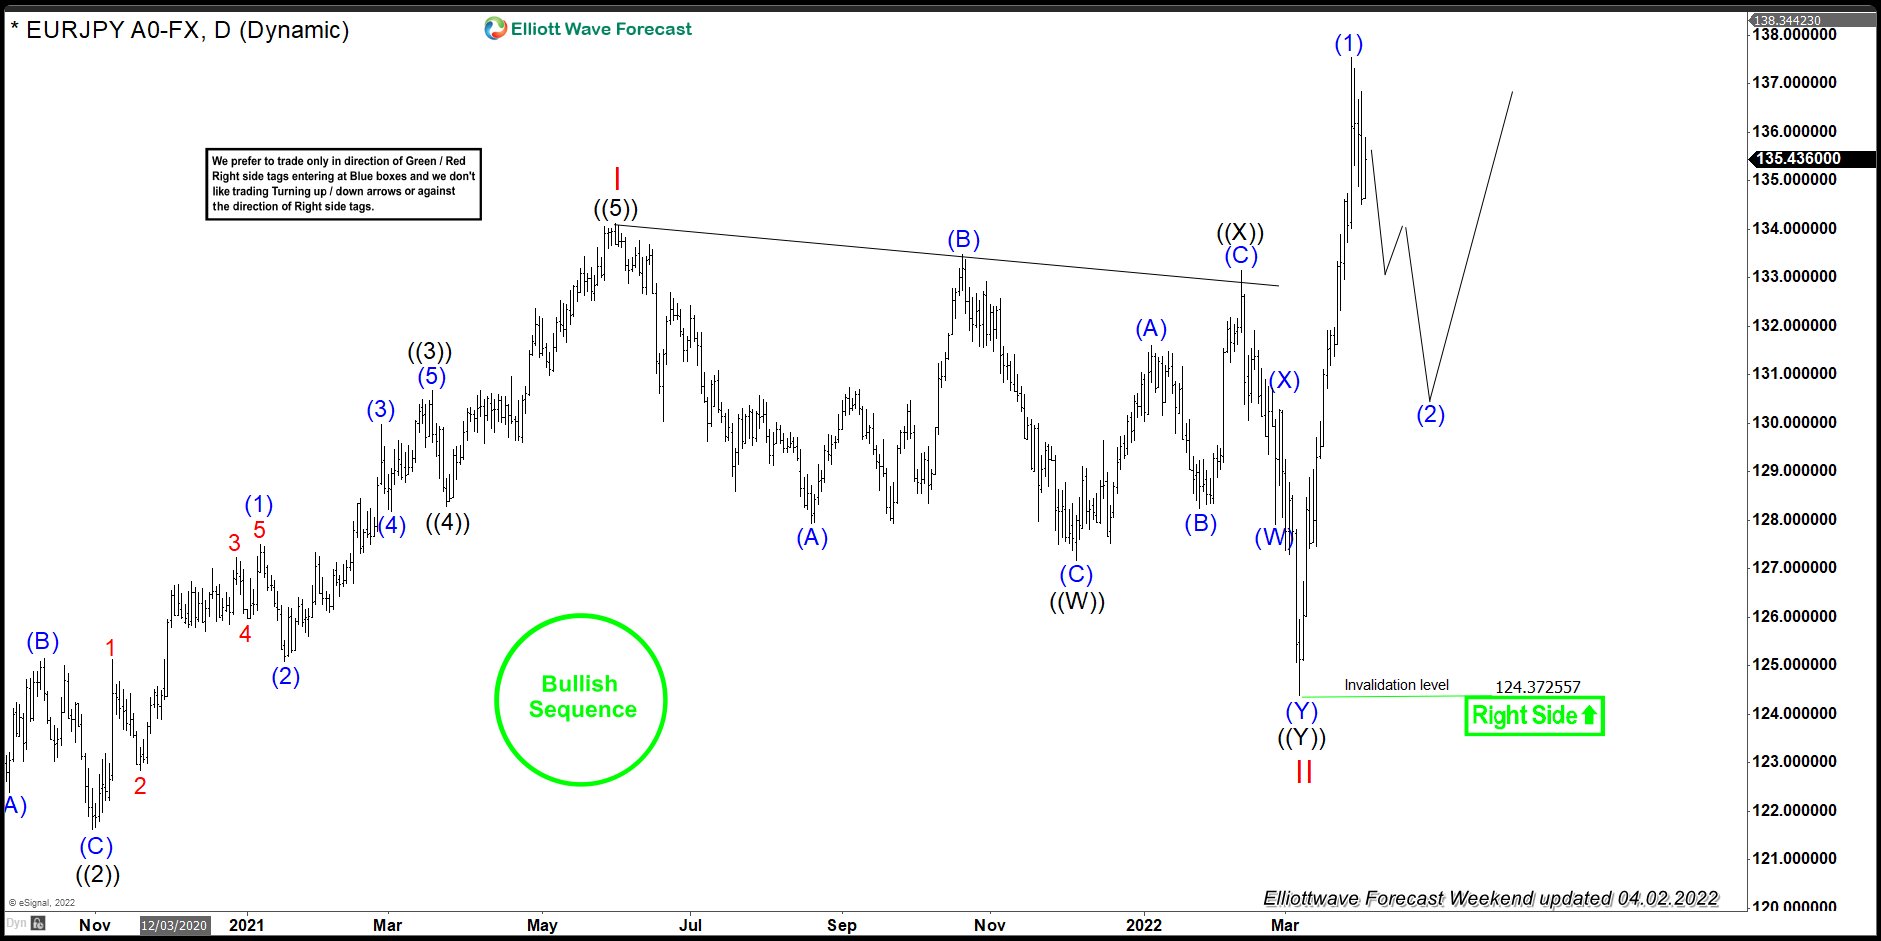
EURJPY Elliott Wave Analysis – Daily Time Frame – April 2, 2022
Chart below shows EURJPY extended the decline and went on to break below December 2021 low as expected to finish correcting May 2020 cycle. It found a low on March 7, 2022 at 124.39 and rallied to a high of 137.54 on March 28, 2022. Cycle from 124.39 low ended and pair is now expected to pull back to correct the cycle from March 7, 2022 low before pair turns higher to resume the rally. Right side is up and as dips hold above March 7, 2022 low, we expect pair to find buyers in the dips in 3, 7 or 11 swings.
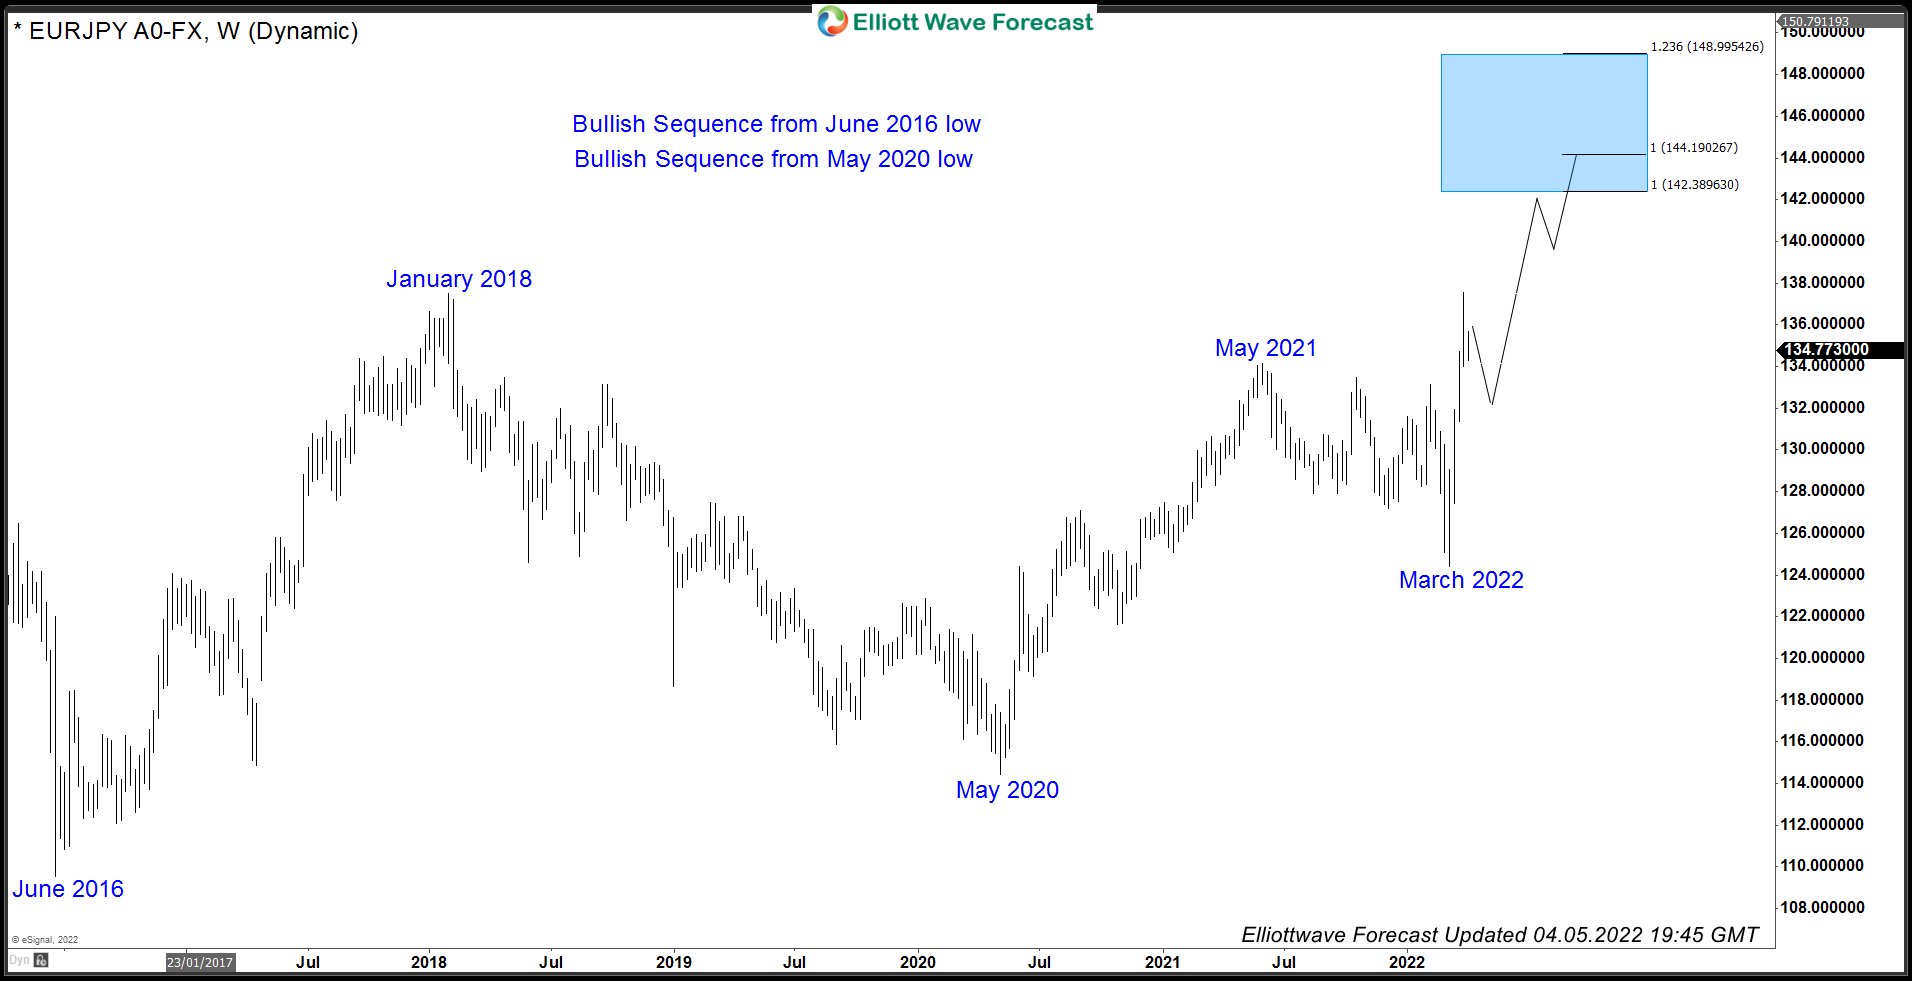
EURJPY Double Incomplete Bullish Sequence
Pair recently broke above May 2021 peak and also broke above January 2018 peak which creates a double incomplete bullish sequence with target area between 142.38 – 148.99 at least. As dips hold above March 2022 low, buyers should remain in control and expect the pair to find buyers in the dips in 3, 7 or 11 swings.
Back


