Bitcoin is still considered as the currency of the Dark Web, despite the fact that it was the world’s best performing currency in 2015 & 2016 and currently 1 Bitcoin (BTCUSD) is worth 2 Ounces Of Gold which is significantly important in the financial world. The digital currency continued it’s outstanding performance during this year with +200% but Ethereum has taking over the show with +3000% rise since January.
We implemented our Elliott Wave technique in our previous articles to predict the rise of Bitcoin and how it was looking to make new all time highs. Then we explained that despite BTCUSD was reaching a Warning Stage, it would remain bullish looking for more gains to come.
Bitcoin managed to reach $3000 on 06/12 which is new milestone for Bitcoin, then it saw a 30% correction which presented another opportunity to buy it again as we mentioned that the currency is a buy into dips using the corrective sequence 3 , 7 or 11 swings to find good entries. So let’s take a look at the current chart and see the potential coming move.
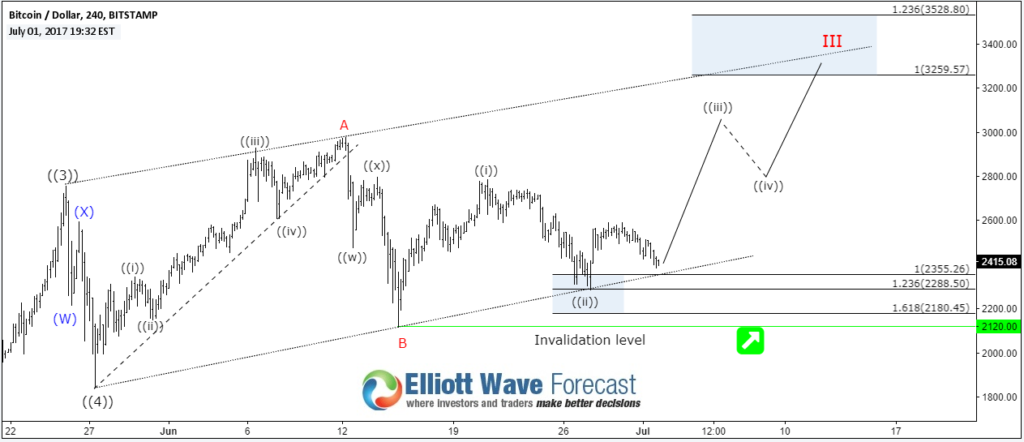
BTCUSD 4H Chart 07/01/2017

BTCUSD cycle from 2015 lows remain in progress and the instrument currently still has the potential to add another leg higher toward $3250 – $3500 at minimum before ending wave III and doing a larger pullback. However we need to keep in mind that the third wave is usually the strongest one and can keep adding more extension to the upside. Consequently, it’s not recommended to sell the instrument and until the pivot at 06/15 low 2120 gives up you should keep trading with the main bullish trend.
To add more conviction to the above view we can use a correlated different type of instrument and until the crypto-currency gets approved for it’s own proper ETF, we can use The Grayscale Bitcoin Investment Trust GBTC (Its shares represent almost 1/10 of a Bitcoin).
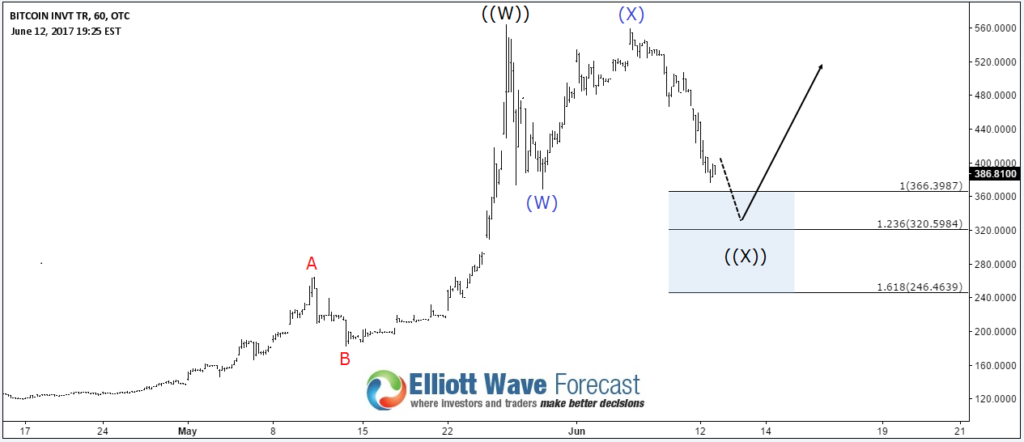
GBTC 1H Chart 06/12/2017

GBTC is sharing the same oscillation with Bitcoin with a slightly different cycle because the instrument did a double three structure to correct the whole cycle from 2016 low. It found buyers at extreme area 366-246 and now it could have started a new bullish cycle which can take it toward $870 – $940 area and that will support the Bitcoin move higher.
What would happen if both instruments fails to make new highs ?
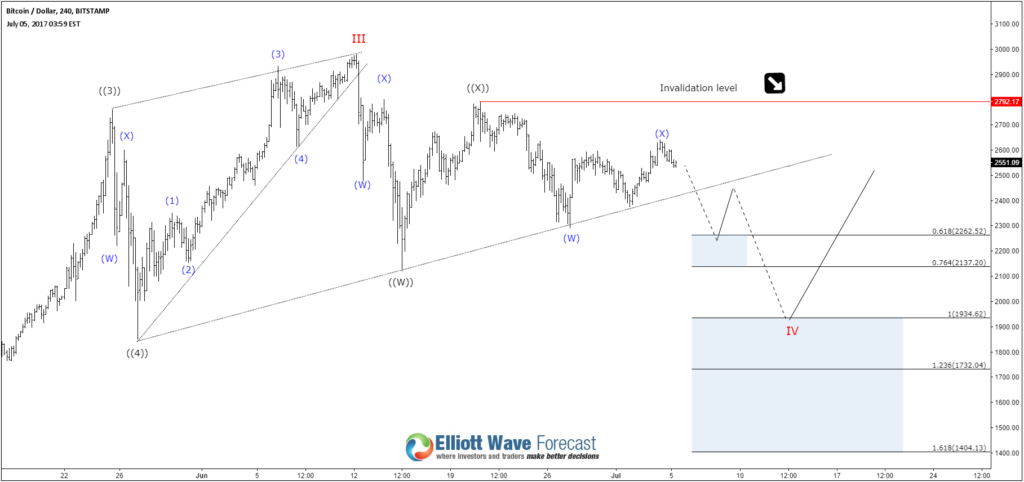
In that case there is no need to panic because GBTC will extend it’s correction lower and can be bough later on at the next extreme area around $200 from May peak. If BTCUSD pivot at 2120 low gives up then wave III could be already in place and it will do the double correction from June peak toward $1930 – $1725 area which will be the next area to look for buyers.
BTCUSD 4H Chart 07/05/2017

Recap
BTCUSD bullish cycle remain in progress with a potential move higher toward $3250 – $3500 area which is also supported by the same oscillation in GBTC provided that June pivot keeps holding.
The crypto-currency market was extremely volatility in the recent months and it presents a lot of risk for short term trader, that’s why you need to have a good system that can help you define your trading areas and use the proper risk management to protect your account. So if you trade or invest in CryptoCurrencies and you are interested in further structures & sequences then you can start by learning the basics of the Elliott Wave theory.
Take this opportunity and try our services 14 days for FREE to learn how to to trade forex, indices, commodities and stocks using our blue boxes and the 3, 7 or 11 swings sequence . You will get access to our current 52 instruments updated in 4 different time frames, Live Trading Room and 2 Live Analysis Session done by our Expert Analysts every day, 24-hour chat room support and much more.
Back

