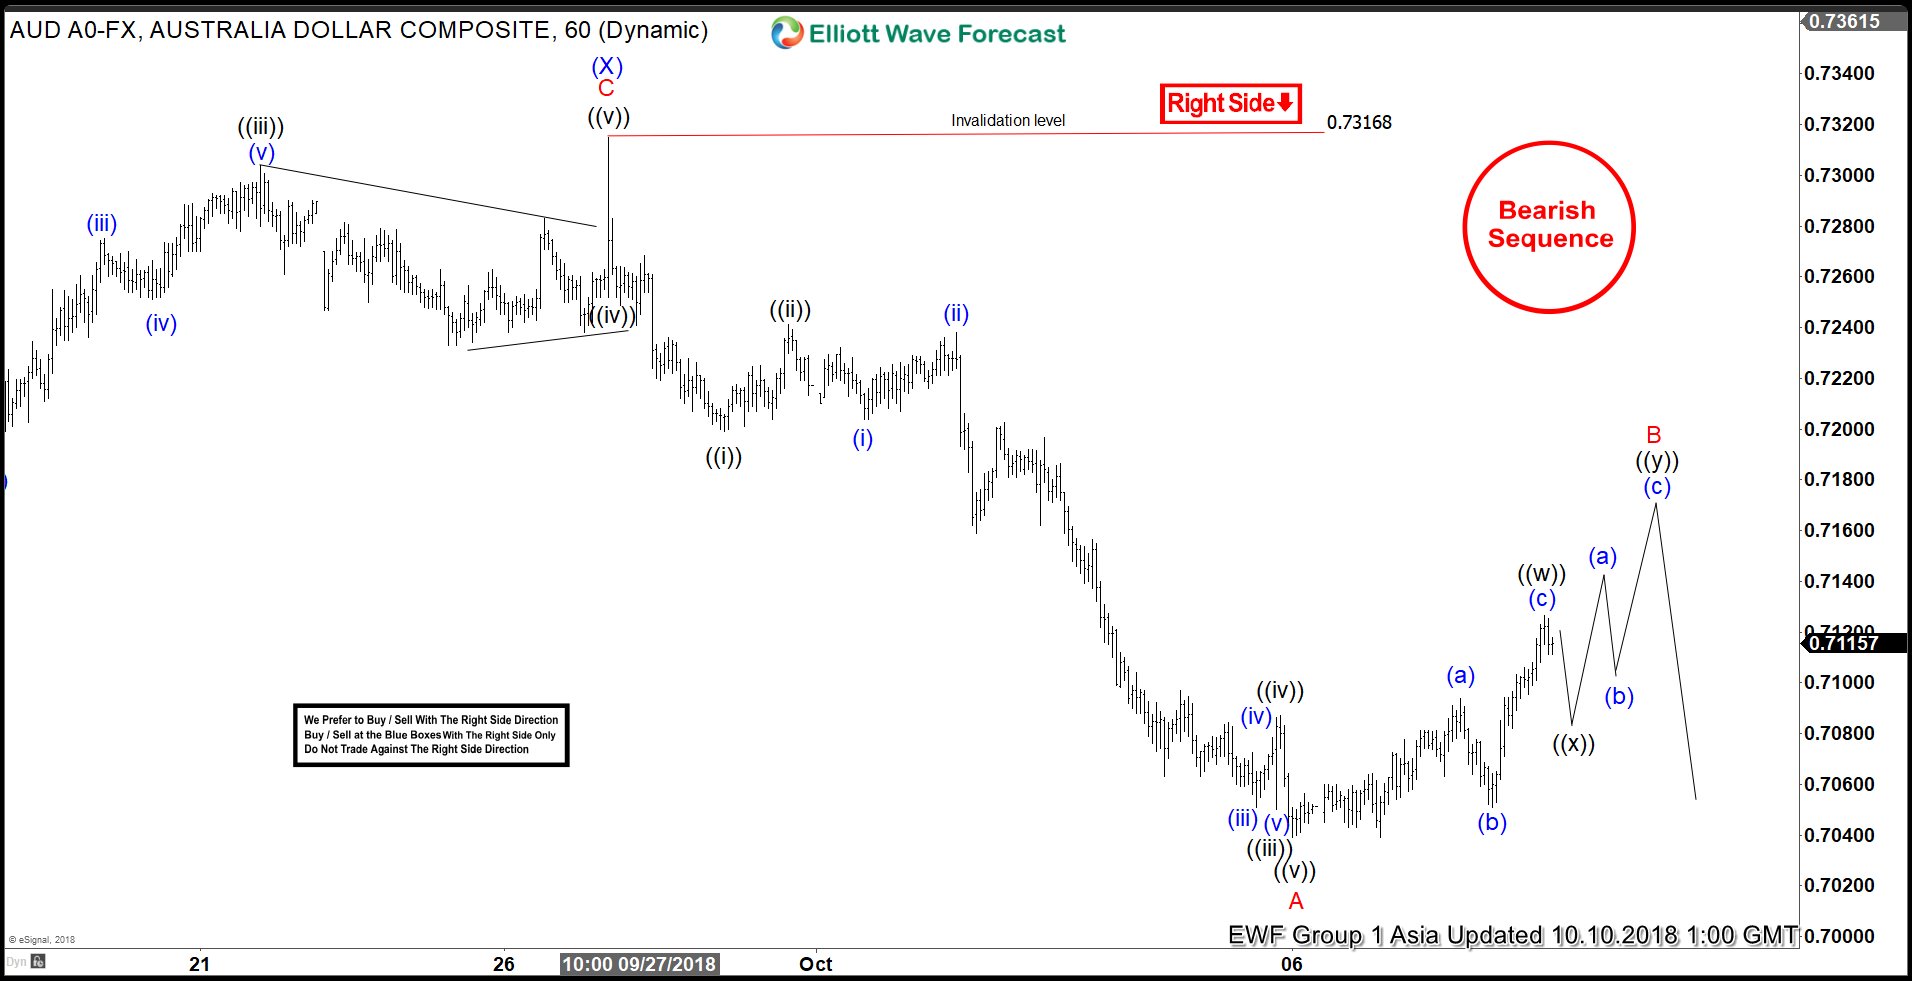
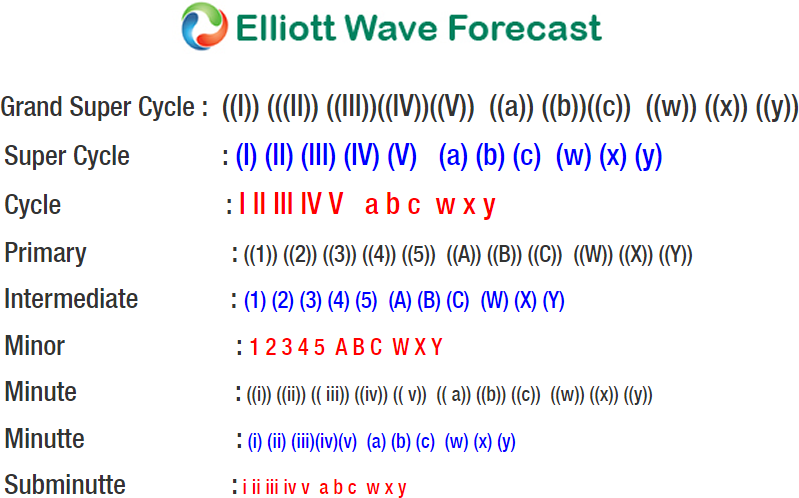
AUDUSD short-term Elliott wave view suggests that the bounce to 0.7316 high ended intermediate wave (X). Down from there, intermediate wave (Y) remain in progress as a zigzag structure. Where initial decline to 0.7049 low ended in 5 waves impulse structure & also completed the Minor wave A lower. Also, it’s important to note that the pair is having a bearish sequence tag & right side lower, therefore, buying is not recommended.
The lesser degree cycles within Minor wave A ended Minute wave ((i)) at 0.7201. A bounce to 0.7240 high ended Minute wave ((ii)). Then a decline to 0.7051 low ended 5 waves in Minute wave ((iii)). Above from there, the bounce to 0.7086 high ended Minute wave ((iv)). Then finally, a push lower to 0.7049 low ended Minute wave ((v)) & also completed Minor wave B. Up from there, Minor wave B bounce remains in progress as double three structure before decline resumes. We expect sellers to appear in 3, 7 or 11 swings within wave B bounce against 0.7316 pivot.
AUDUSD 1 Hour Elliott Wave Chart
We provide precise forecasts with up-to-date analysis for 78 instruments. These include Forex, Commodities, World Indices, Stocks, ETFs and Bitcoin. Our clients also have immediate access to Market Overview, Sequences Report, 1 Hour, 4 Hour, Daily & Weekly Wave Counts. In addition, we also provide Daily & Weekend Technical Videos, Live Screen Sharing Sessions, Live Trading Rooms and Chat room where clients get live updates and answers to their questions. The guidance of ElliottWave-Forecast gives subscribers the wherewithal to position themselves for proper entry and exit in the markets. We believe our disciplined methodology and Right side system is pivotal for long-term success in trading.
Back


