Hello fellow traders. Another trading opportunity we have had lately is AUDNZD. In this technical blog we’re going to take a quick look at the Elliott Wave charts of AUDNZD published in members area of the website. In further text we’re going to explain the forecast and trading setup.
As our members know, AUDNZD have had incomplete bullish sequences in the cycle from the April 12th low, suggesting further strength. On July 3th AUDNZD has broken previous peak from 05/25/2018 and open further extension to the upside. Consequently, we advised our members to avoid selling it and keep on buying the dips in the sequences of 3,7,or 11 swings.
Let’s take a look at the previous short term Elliott Wave forecasts.
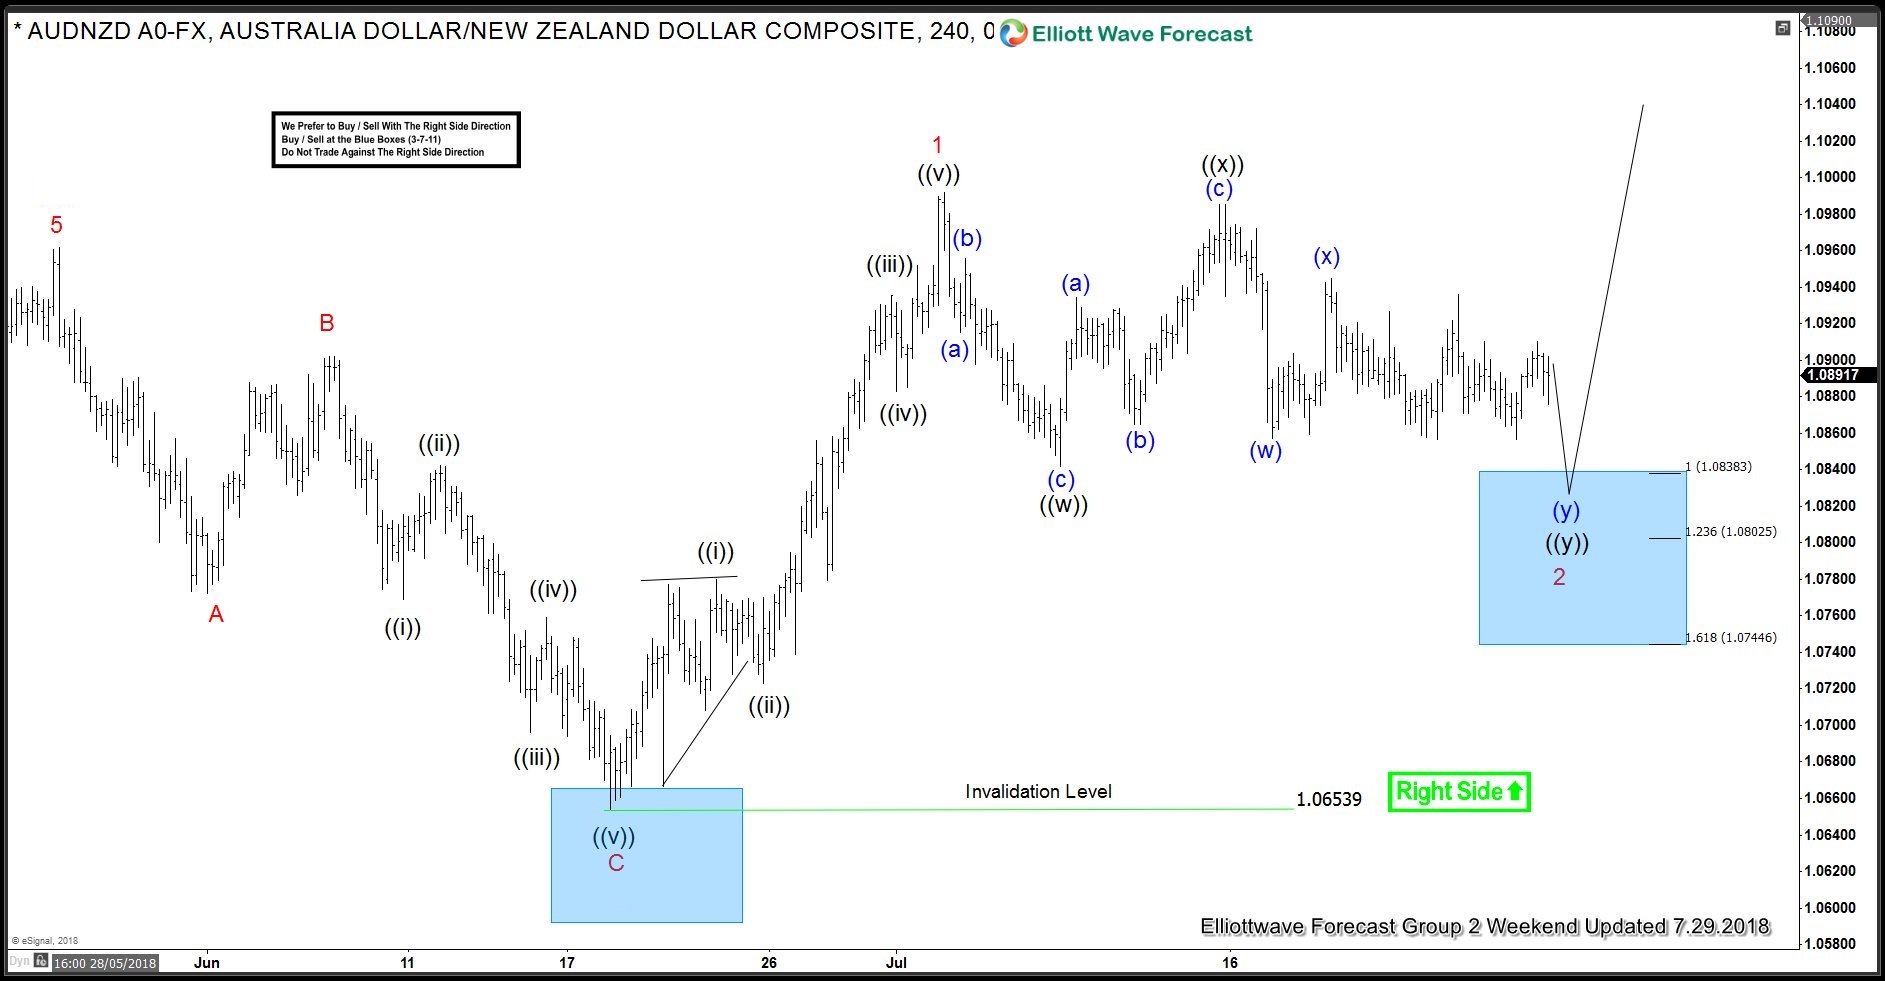
AUDNZD 4 Hour Elliott Wave Analysis 7.29.2018
Current view suggests the price is still doing wave 2red pull back , correcting the cycle from the 1.0653 low. As far as the price stays below (x) blue high, the pair has chance to reach 1.08383-1.08025 ( buying zone). If AUDNZD manages to reach proposed buying zone 1.08383-1.08025, we will open long positions there. From that area we expect to get either further decline or 3 wave pull back alternatively. Anyway, as soon as the price reaches 50 Fibonacci Retracement against the ((x)) black high, we will make our Long positions Risk Free. Stop Loss of the trade is break below 1.618 Fibonacci extension (1.07446)
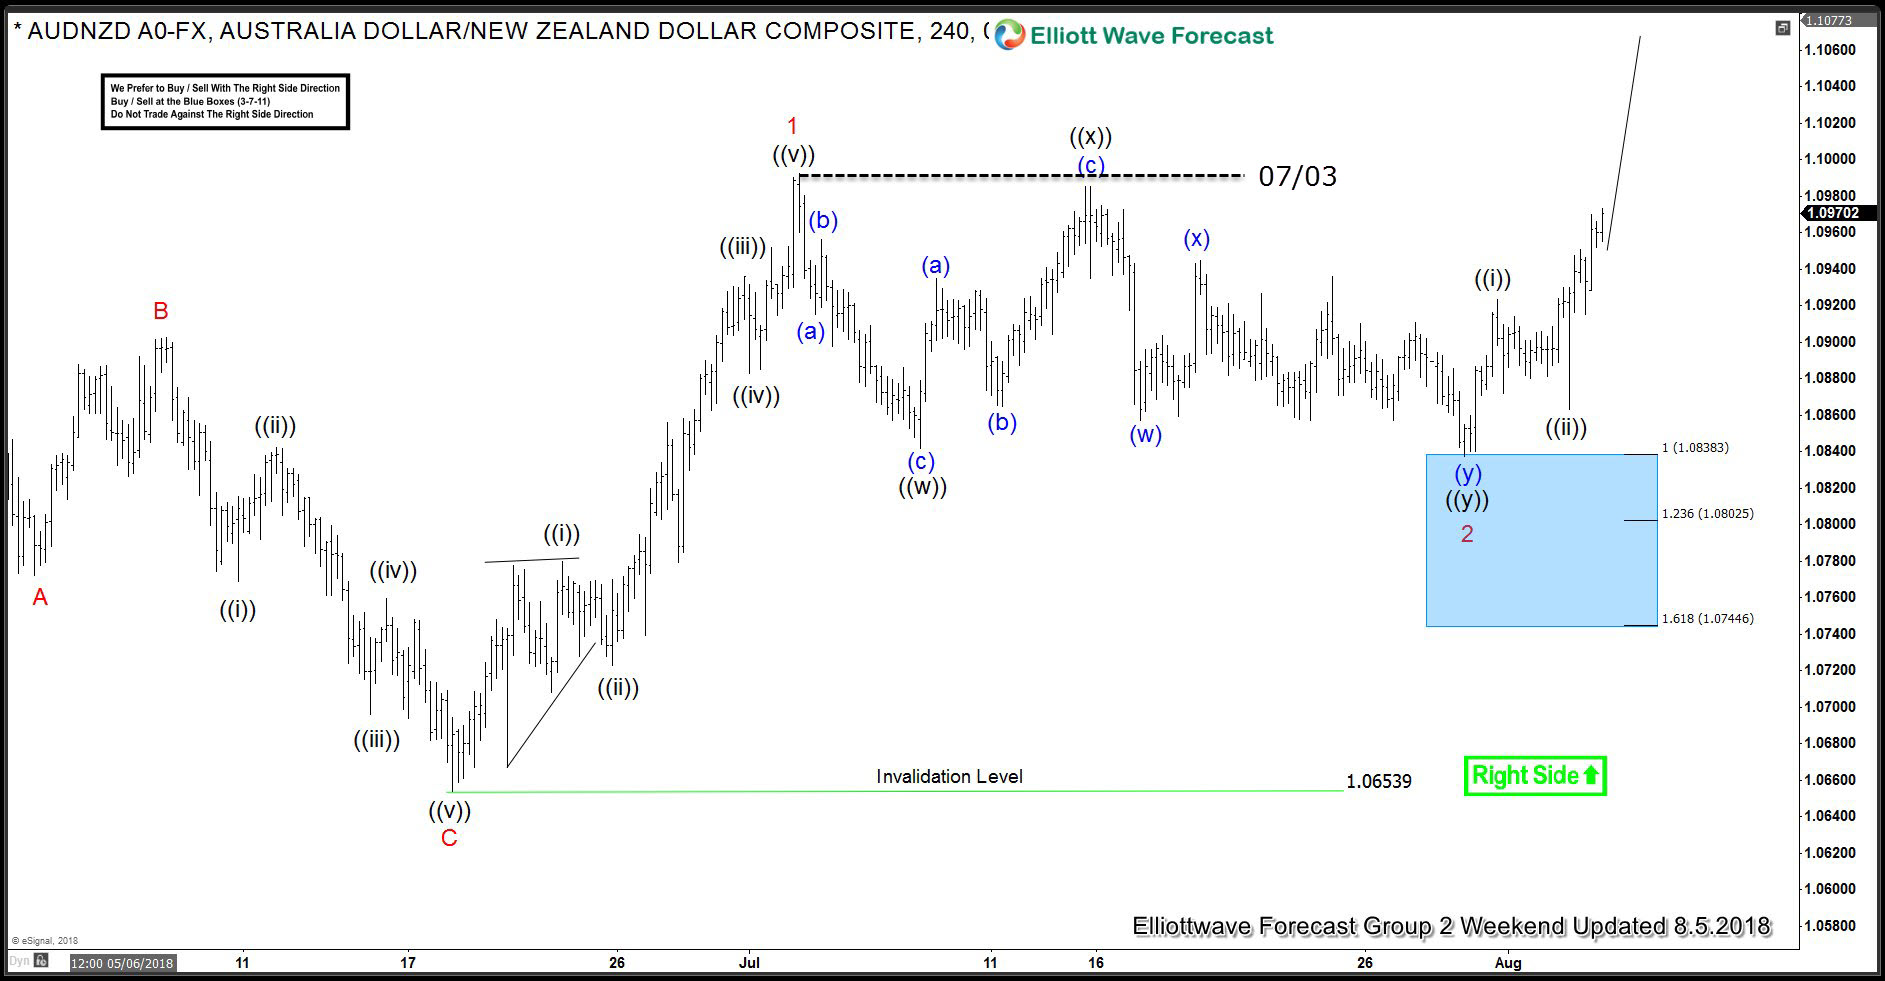
AUDNZD 4 Hour Elliott Wave Analysis 8.5.2018
The price has given us forecasted leg lower and reached buying zone at 1.08383-1.08025. Pull back wave 2 red has ended right at equal legs area from the 07/03 peak. As a result members are now enjoing profits with risk free positions. We would like to see break above 07/03 peak to get confirmation that next leg higher is in progress.
Note: Market is dynamic and presented view could have changed in the mean time. Best instruments to trade are those having incomplete bullish or bearish swings sequences. We put them in Sequence Report and best among them are shown in the Live Trading Room.
Elliott Wave Forecast
We cover 78 instruments in total, but not every chart is trading recommendation. We present Official Trading Recommendations in Live Trading Room. If not a member yet, Sign Up for Free 14 days Trial now and get access to new trading opportunities. Through time we have developed a very respectable trading strategy which defines Entry, Stop Loss and Take Profit levels with high accuracy.
Welcome to Elliott Wave Forecast !
Back


