Hello fellow traders. In this technical blog we’re going to take a quick look at the Elliott Wave charts of AUDCAD published in members area of the website. On April 20th, the pair broke 04/12 low and open further extension to the downside. Mentioned broke made cycle from the March 13th peak incomplete and the pair has become bearish against the 0.9858 peak. Consequently, we advised clients to avoid buying the pair keep on selling the rallies in the sequences of 3-7-11 swings .
Now let’s take a look at the short term Elliott Wave forecasts explain the view and trading strategy.
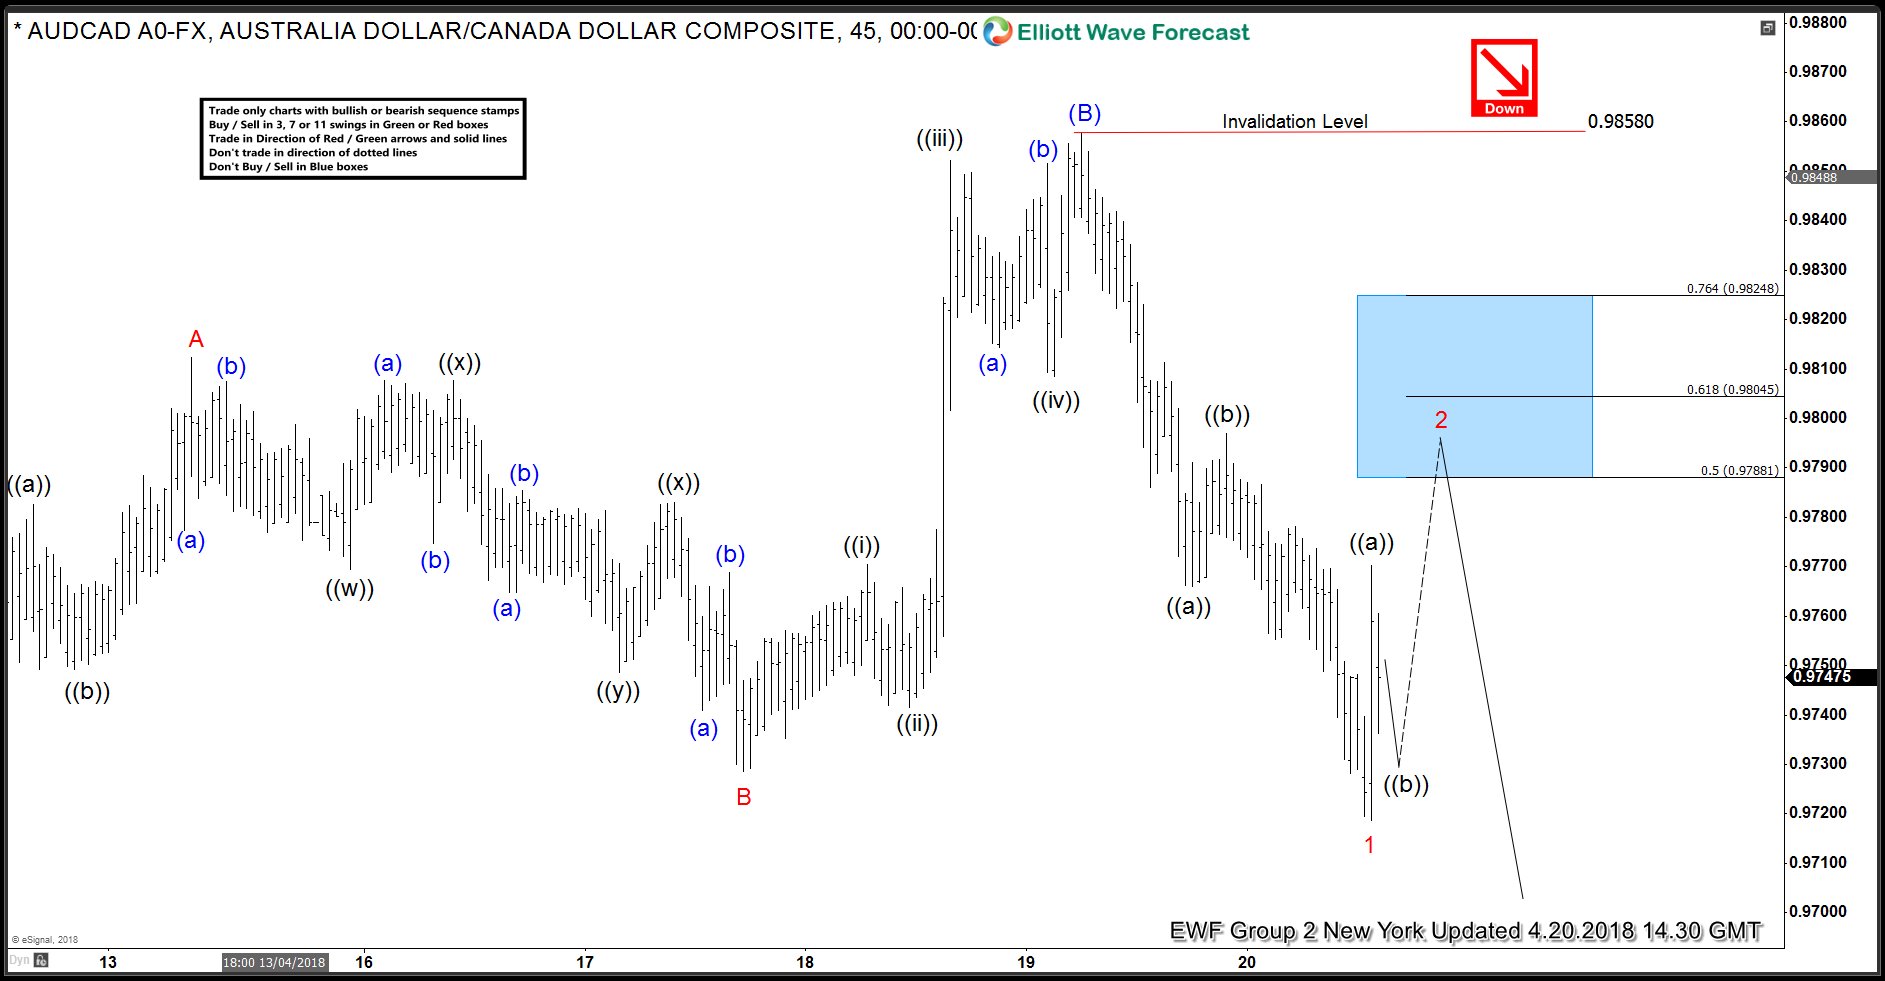
AUDCAD Elliott Wave 1 Hour Chart 4.20.2018
Current view suggests the pair has ended cycle from 0.9858 peak which we have labelled as red wave 1 of a diagonal wave (C). Pair is now bouncing in wave 2 to correct the cycle from 0.9858 peak. While above red wave 1 low (0.9718) , the pair has chance to make another leg up to complete clear 3 waves against the mentioned peak . Until price ends wave ((b)) of 2, we have to use 50-.618 Fibonacci retracement zone as a potential turning area. That zone comes at 0.9788-0.9804 and we like to be sellers there. Strategy is waiting for clear 3 wave bounce in wave 2 red correction and then selling the pair at ((a))-((b)) equal legs area which would be worked out later once we have had confirmation that wave ((b)) is over and pair has broken above the high of wave ((a)).
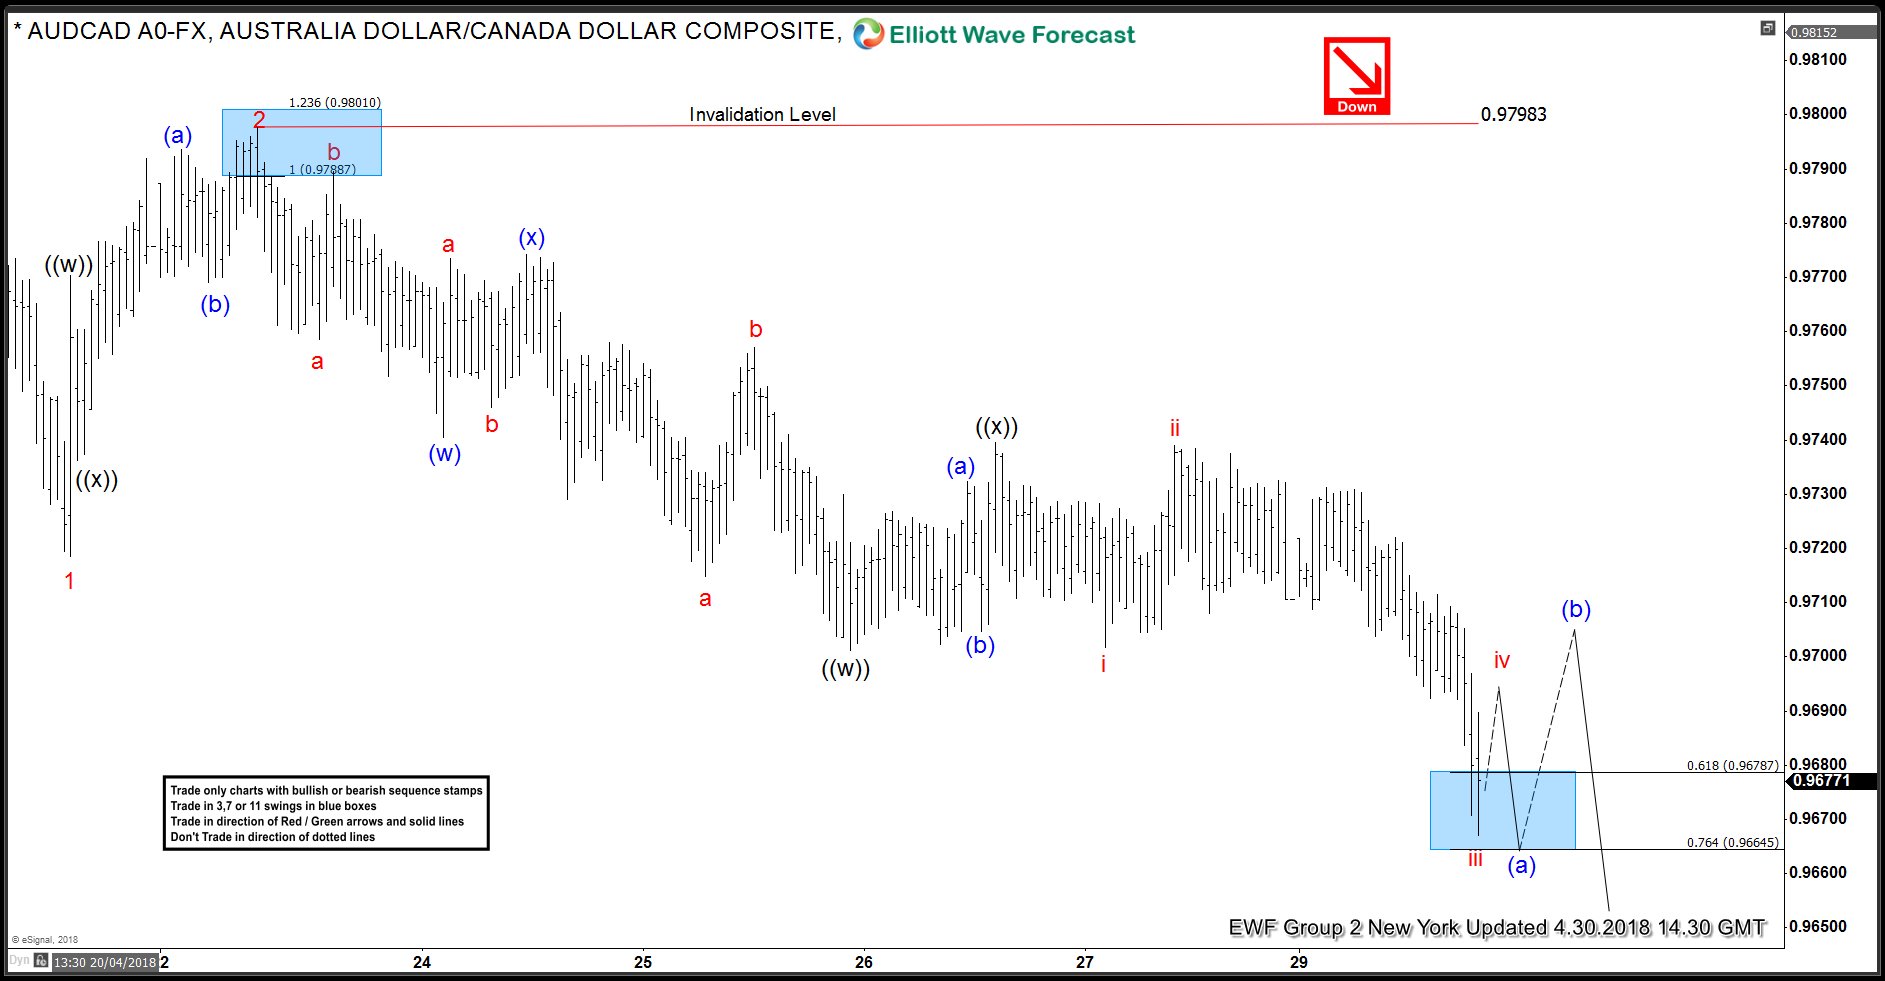
AUDCAD Elliott Wave 1 Hour Chart 4.30.2018
The pair has given us another leg up against the 0.9858 peak. It reached inner equal legs at 0.97887-0.9801 (sell z0ne) and gave us reaction from there. AUDCAD has already made new lows below proposed red wave 1 low at 0.8718 and next areas of interest to the downside are 0.9654 – 0.9619 which is 100 – 123.6 extension area of the decline from 0.9857 – 0.9718 projected lower from 0.9798 high. Below that, we could be looking at the internal equal legs area down from 0.9798 peak which lies between 0.9641 – 0.9618. Keep in mind the market is very dynamic and short term view could have changed or not be valid any more when you look at this chart. Best instruments to trade are those having incomplete bullish or bearish swings sequences. We put them in Sequence Report and best among them are shown in the Live Trading Room.
Elliott Wave Forecast
We cover 78 instruments in total, but not every chart is trading recommendation. We present Official Trading Recommendations in Live Trading Room. If not a member yet, Sign Up for Free 14 days Trial now and get access to new trading opportunities.
Back


