Chainlink (LINK) is set to extend the recovery from May 2023. However, it must finish the current pullback from the high of December 2024. Where will the pullback most likely finish for buyers to find fresh entries?
Chainlink (LINKUSD) is a decentralized oracle network that enables smart contracts on blockchains to securely interact with real-world data, APIs, and external systems. It plays a critical role in enhancing the functionality of blockchains, as most of them cannot directly access external data.
From January 2019 when it was first listed on Binance, $LINKUSD completed a 5-wave rally which we can identify as wave ((1)). Wave ((1)) finished in May 2021 and a pullback ensued for wave ((2)). Meanwhile, wave ((2)) finished in June 2023 after completing a zigzag structure and a new resurgence started. While the height of May 2021 has not yet been reached, prices have completed a 5-wave rally from wave ((2)) low which we consider as wave (1) of ((3)).
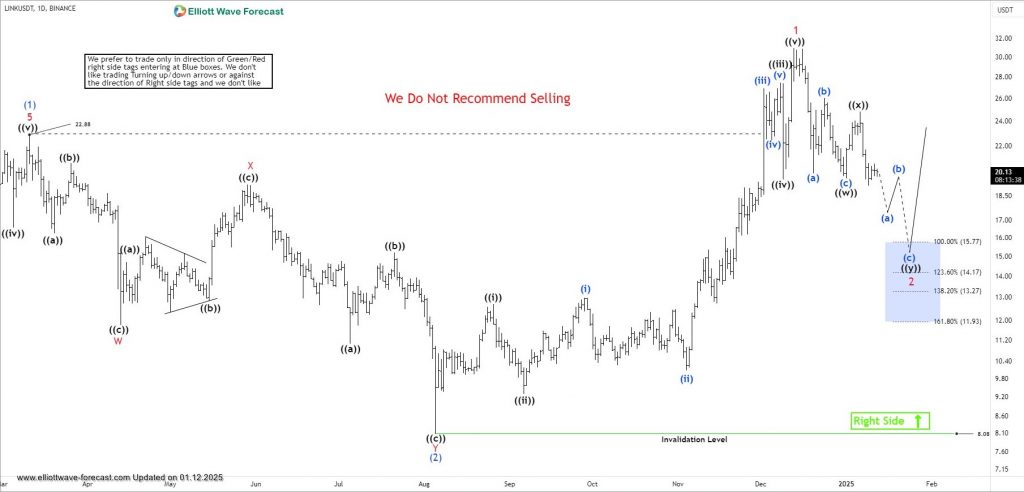
CHAINLINK (LINKUSD) Daily Chart – 01.12.2025
Wave (1) finished in March 2024 and a pullback for wave (2) followed and finished in August 2024 as the daily chart above shows. From the low of August 2024, price rallied with an impulse structure to break the peak of wave (1). Therefore. we can identify this as wave 1 of (3). Thus, current pullback from the top of December 2024 should be wave 2 of (3). The wave 2 pullback is emerging as a double zigzag structure. Wave ((w)) and ((x)) of 2 have already finished. Therefore, price is in wave ((y)) of 2. Wave ((y)) could extend to 15.77-11.93 where it could find the needed support to begin wave 3. Buyers should watch out for this zone for fresh opportunities.
What’s The Target For Wave 3?
If wave 2 extends to the zone, we will expect at least a 3-swing bounce if not the start of a 5-wave resurgence for wave 3 of (3). Wave 3 of (3) is often the strongest within an impulse structure. Thus, wave 3 could extend to $52 if wave 2 will not extend lower after a bounce. A modest target would be $38-46 (100%-138.2% of wave 1 from 2).
About Elliott Wave Forecast
At www.elliottwave-forecast.com, we update one-hour charts four times daily and four-hour charts once daily for all 78 instruments. We also conduct daily live sessions to guide clients on the right side of the market. Additionally, we have a chat room where moderators answer market-related questions. Experience our service with a 14-day trial for only $9.99. Cancel anytime by contacting us at support@elliottwave-forecast.com.
Back
