In this article, we will take a look at the rally which took place in Gold ($XAUUSD) since April 2019 low. We will present a series of charts to show what the forecast was and how it unfolded.
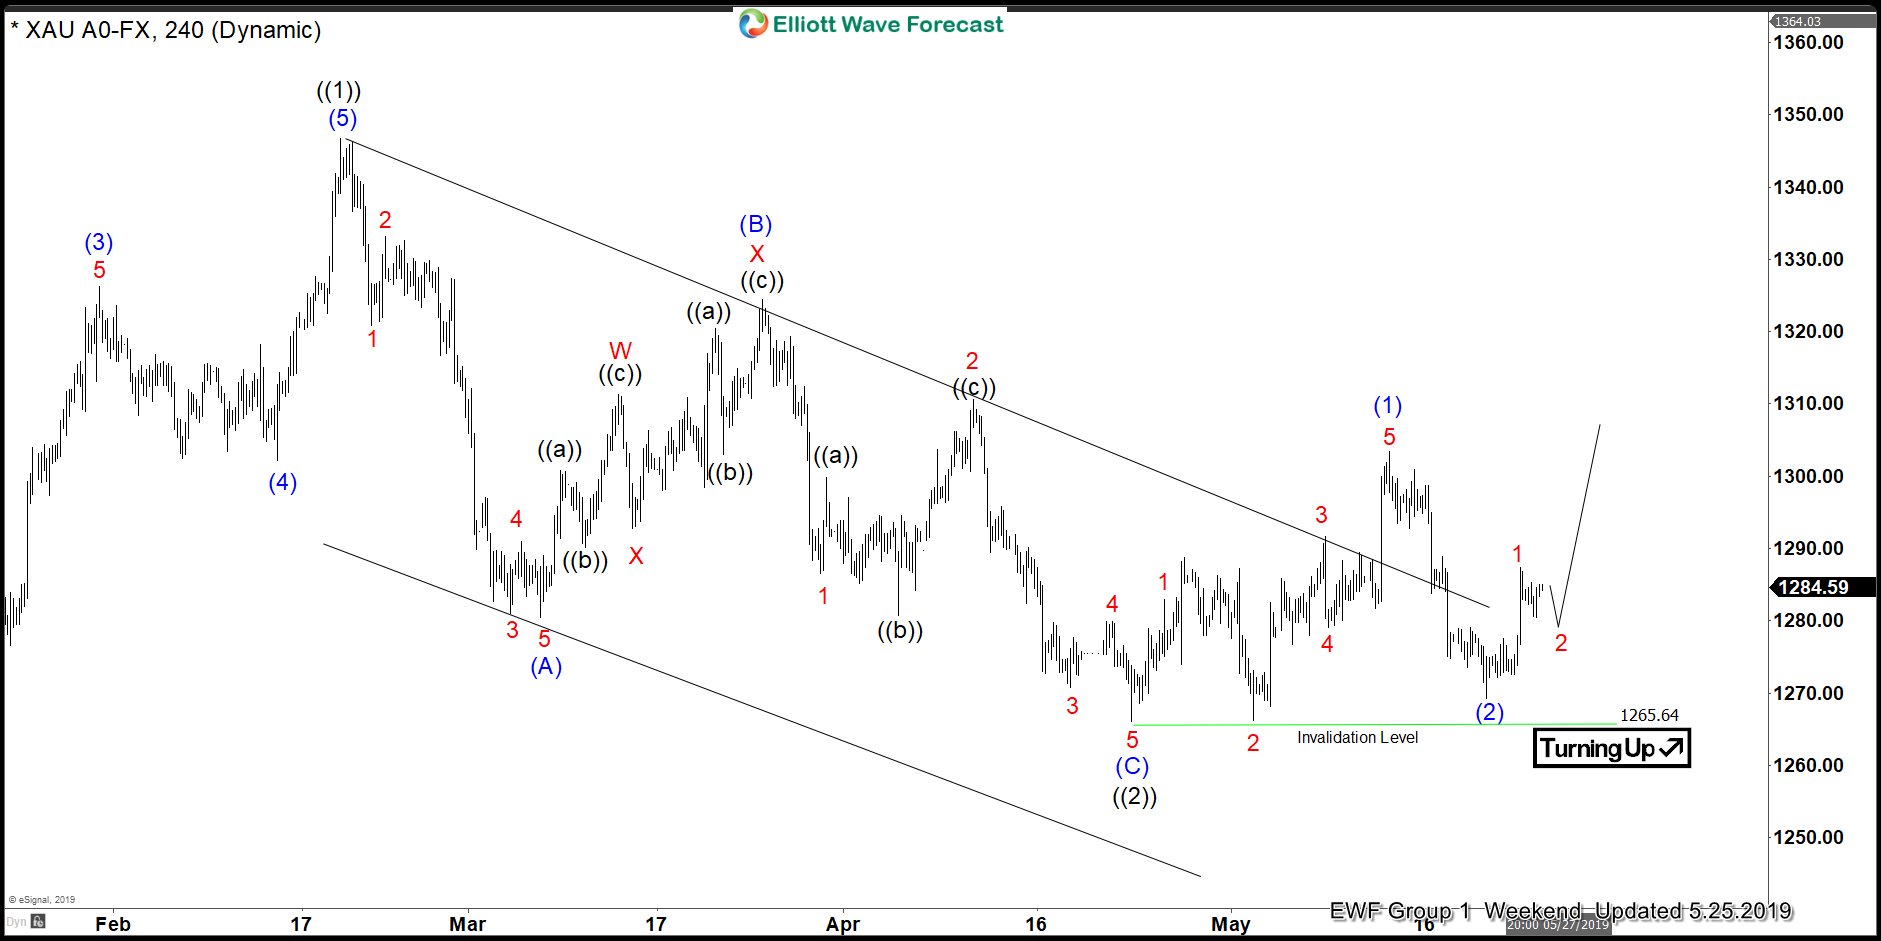
$XAUUSD 4 Hour Elliott Wave Analysis 5.25.2019
Chart below shows wave (( 2)) completed at $1265.64 on 4.23.2019 and up from there, wave ( 1) of (( 3)) ended at $130340, wave (2 ) of (( 3)) ended at $1269.64 and wave (3) higher in progress.
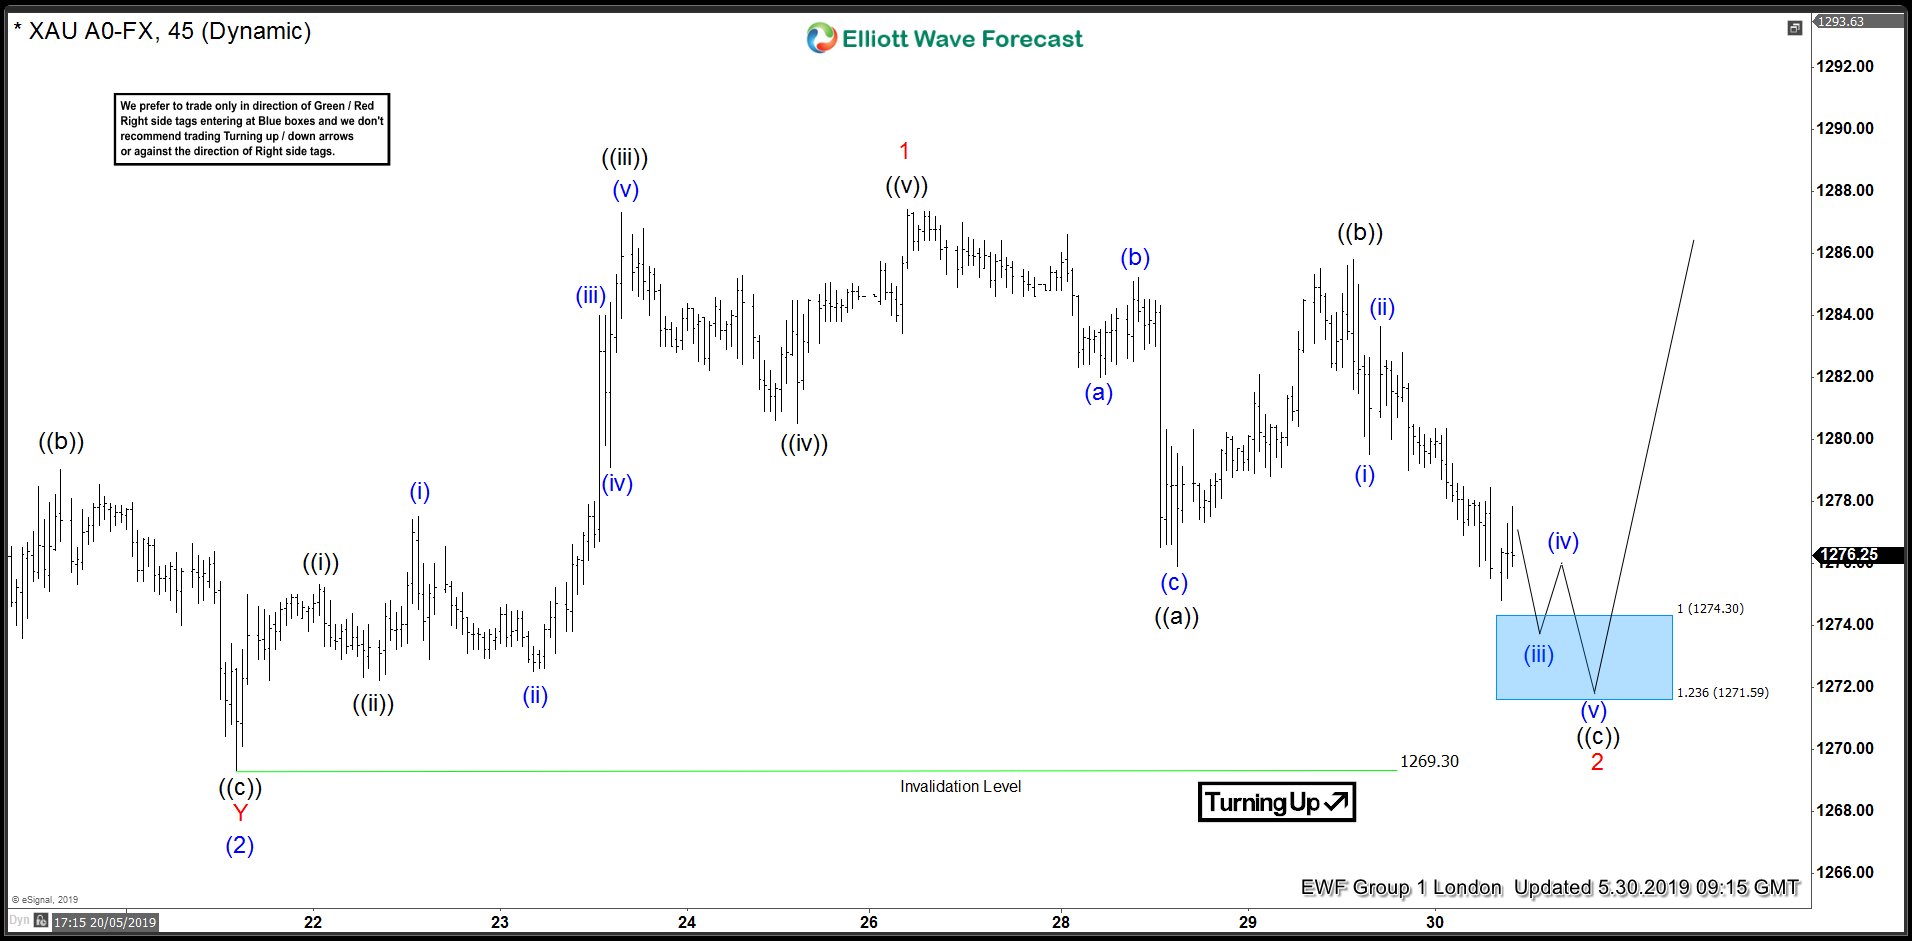
$XAUUSD 1 Hour Elliott Wave Analysis 5.30.2019
Chart below is from 5.30.2019 which showed Gold to be doing a FLAT Elliott Wave structure in red wave 2 expected to complete in the blue box and then rally to resume in wave 3. Price should hold $1269.30 for this view to remain valid.
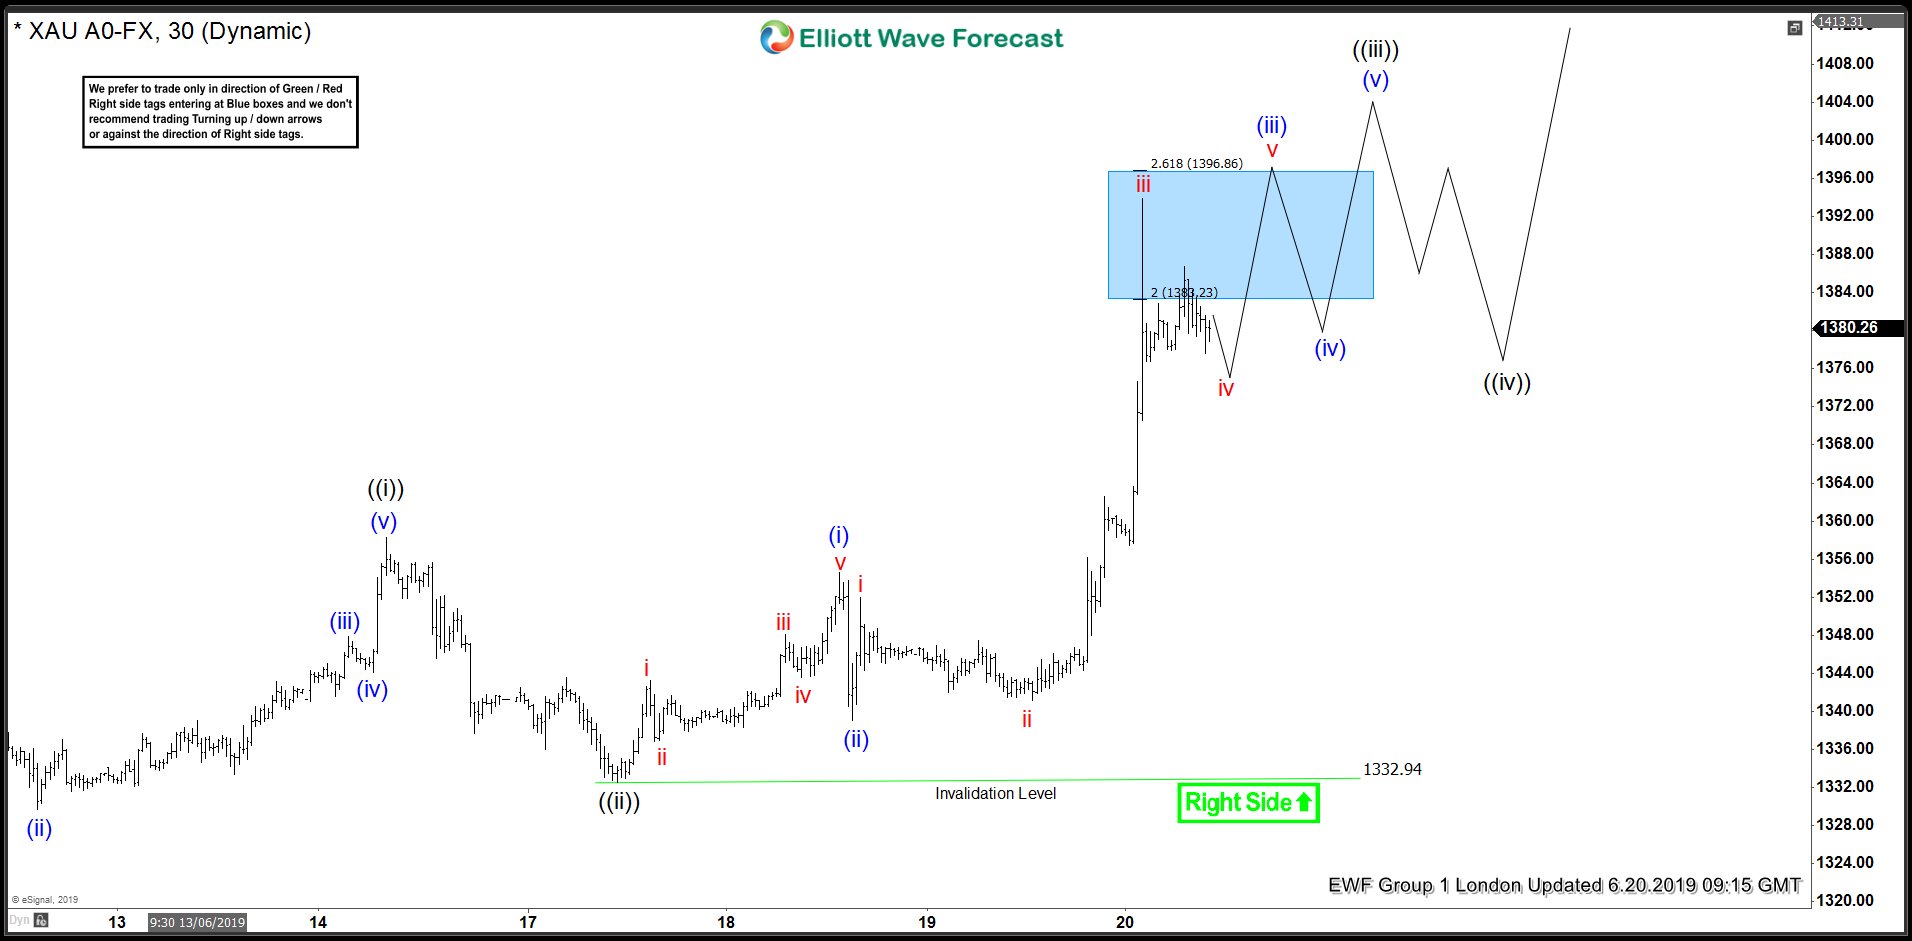
$XAUUSD 1 Hour Elliott Wave Analysis 6.20.2019
About 3 weeks later, we can see Gold did hold the low at $1269.30 and now trading more than $100 above the level it was at in the previous chart. Structure is proposed to be a bullish Elliott wave nest when it’s looking for 1 more high to complete wave (( iii )) of 3 of (3) before we get a pull back in wave (( iv )) and continue higher.
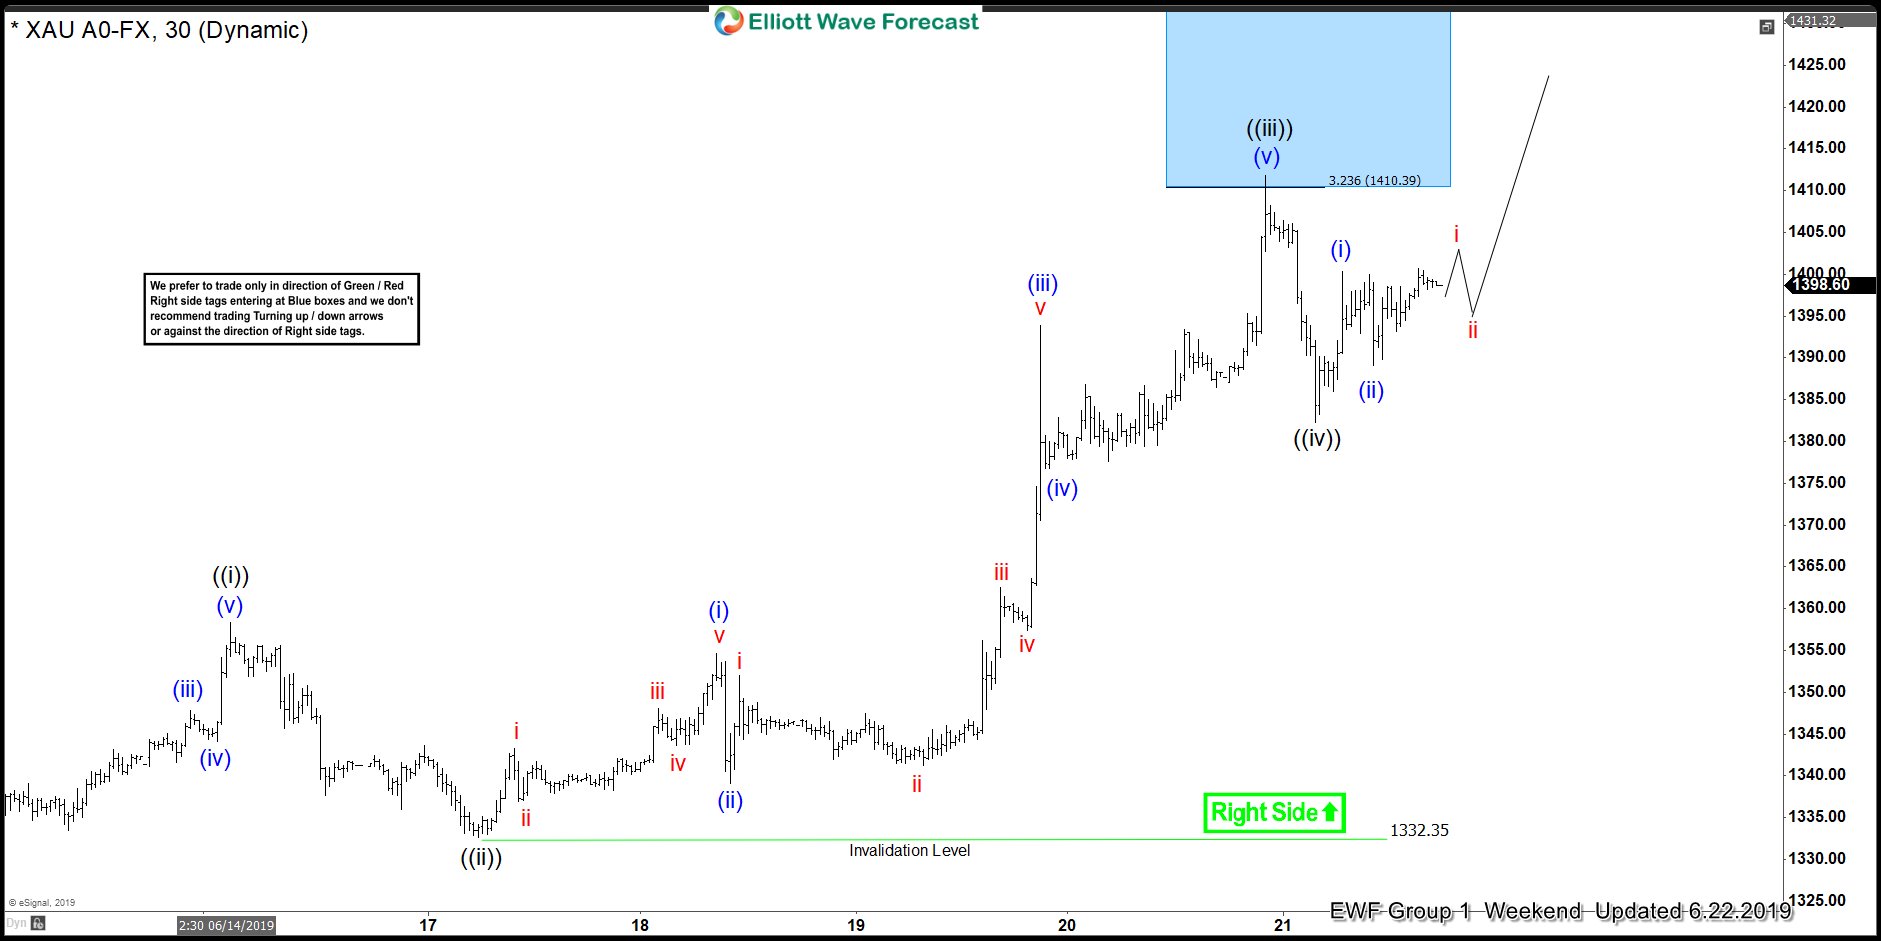
$XAUUSD 1 Hour Elliott Wave Analysis 6.23.2019
Gold continued the rally as expected on 6.21.2019 and made a new high and pulled back in wave ((iv)) as expected. Rally is expected to continue and the structure needs a series of 4’s and 5’s to resolve. As the right side is up, our preferred strategy up until this point has been to buy the dips in the sequences of 3, 7 or 11 swings and we are still favouring more upside and not looking to sell.
Back


