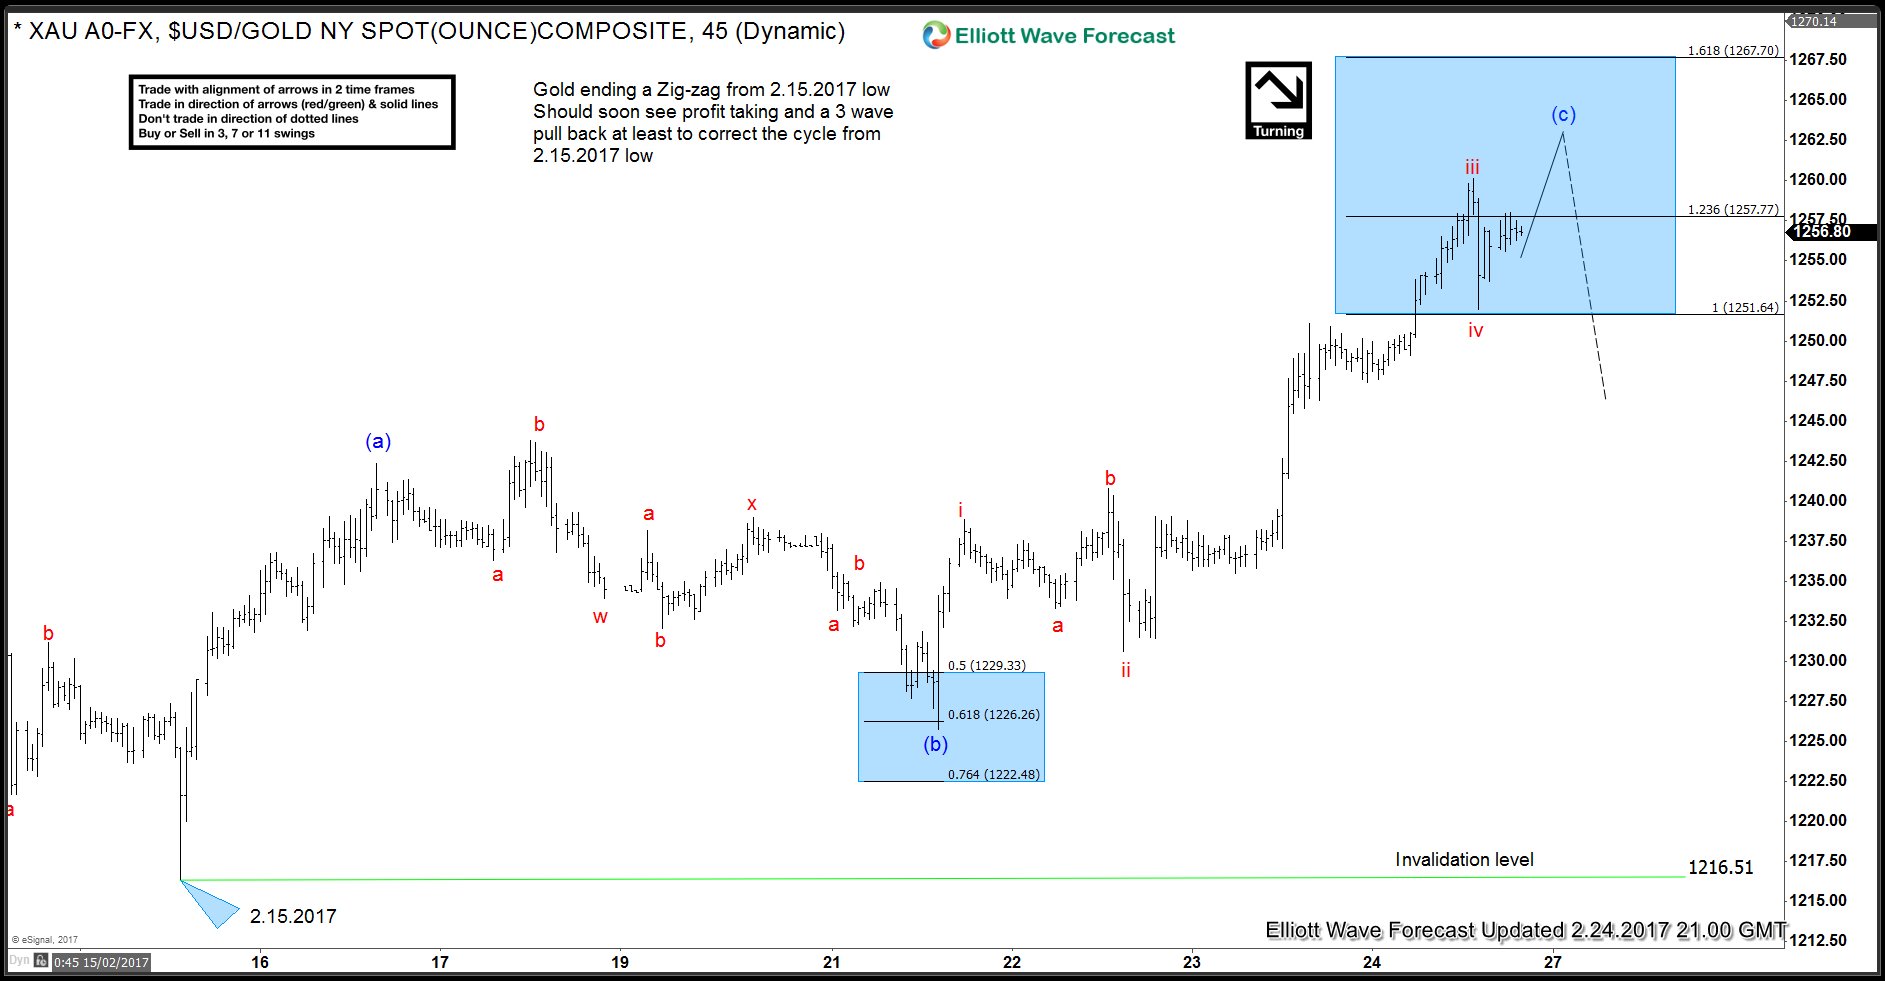
Hello fellow traders. In this blog we’re going to take a look at Gold elliott wave chart and explain the structure in a few sentences. Before we explain current price action, we’re going to take a quick look at the 02/24 chart. As you might remember, in our last blog “ Gold Elliott wave Zigzag pattern” we forecasted a pull back from the 1257.77-1267.70 area.
Gold H1 chart 02/24

Eventualy , we got the last push up in wave v red of (c) and complete Zig Zag Pattern within proposed blue box at 1263.78 high.
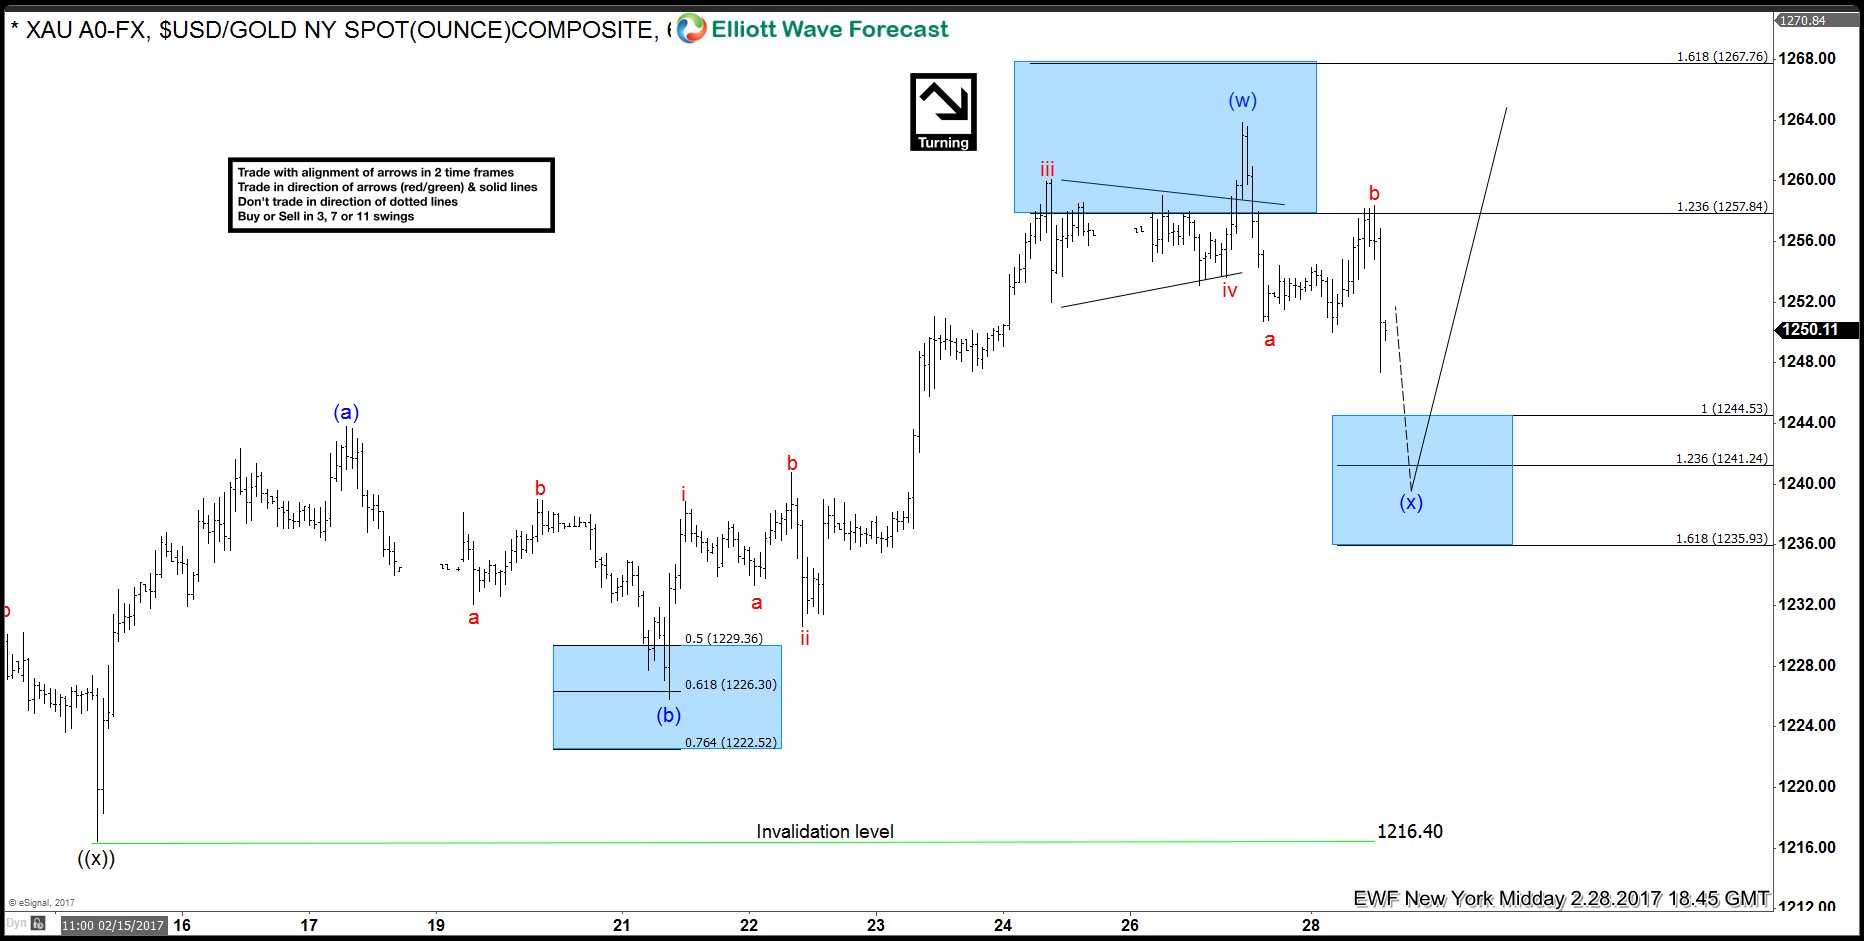
Now, let’s take a look at the current price and explain the structure.
Gold H1 chart 02/28
As we can see the price is correcting the cycle from the 1216.4 low. Current price structure is showing incomplete 3 swings from the 1263.78 peak. Consequently, while below 1258.3 we can see another swing toward technical area :1244.53-1235.93. At above mentioned area, Gold could complete the entire wave ( x) pull back or just the first leg of wave ( x). In other words, it could go to new highs from the mentioned area or bounce in 3 waves to fail against 1263.78 peak and do another 3 swings lower to do a double three structure in wave ( x). In either case, a 3 wave bounce at least is expected from the blue box.

Keep in mind market is dynamic and the view could change in the mean time. If you’re interested in the future path of Gold you will find Elliott Wave analysis in the membership area of EWF. If not a member yet, Sign Up for Free Trial now and get new trading opportunities. Through time we have developed a very respectable trading strategy which defines Entry, Stop Loss and Take Profit levels with high accuracy. If you want to learn all about it and become a professional Trader, join us now for Free. Elliott Wave Forecast keeps you on right side of the market. We provide Elliott Wave charts in 4 different time frames. 3 live sessions by our expert analysts every day. 24 hour chat room moderated by our expert analysts and much more! Welcome to EWF !
Back
