
Oil has dropped to new lows below 95.93 further confirming the idea that 98.83 was the end of wave B. Decline from 98.83 looks like a 5 wave with a wave ( iv ) triangle. Expect a pull back in wave ( b ) toward 97.50 from where Oil should turn lower again. Hourly cycles are negative so we don’t like buying it into proposed wave ( b )
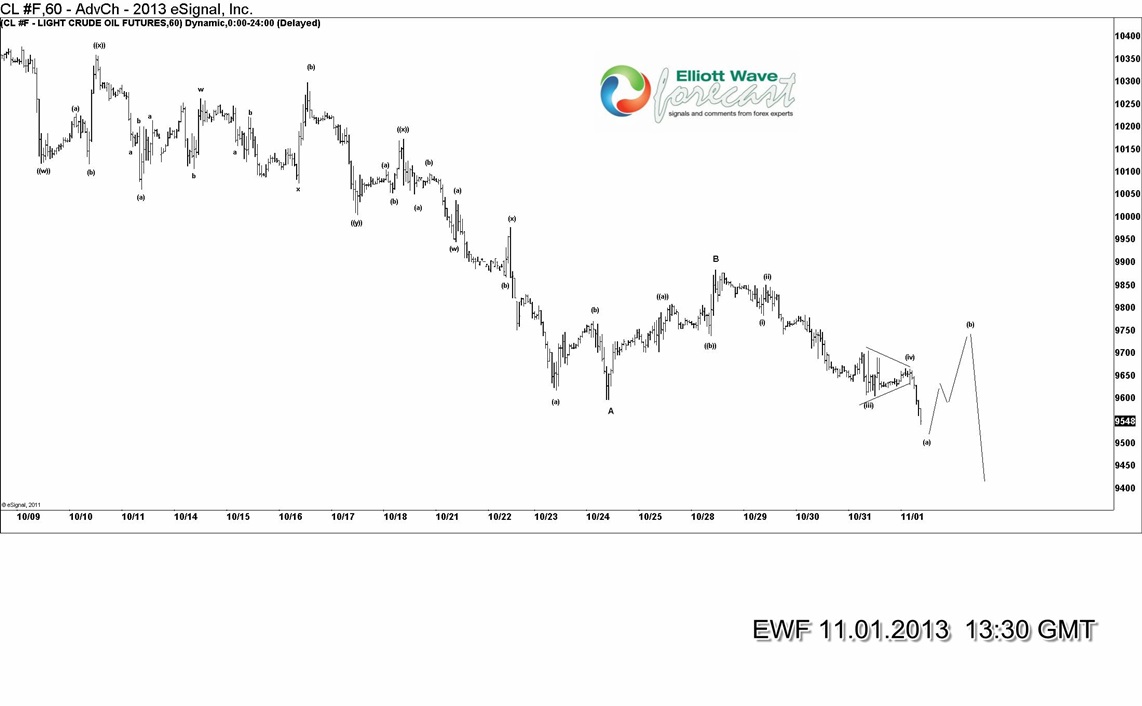
$CL_F (US Oil) 10.31.2013
Commodities
Subscribe to Get Free Market Insights
Professional Elliott Wave insights, charts, and forecasts to guide your trading decisions.
Related Articles
CommoditiesNews
Elliott Wave Outlook: Silver (XAGUSD) Five Wave Advance Signals Bullish Continuation
The short‑term Elliott Wave view in Silver (XAGUSD) indicates a constructive bullish sequence after the...
CommoditiesNews
Gold (XAUUSD) Chart Suggests 7-Swing Double Correction in Elliot Wave Structure
The short‑term Elliott Wave view in Gold (XAUUSD) shows that the rally from the March...
Blue Box WinsCommodities
Gold Buyers Step In at Blue Box Zone — Risk-Free Longs Secured
In this technical blog, we will look at the past performance of the Daily Elliott...



