PNC Financial Services stock recovered its entire 33% 2025 decline. It also broke decisively above its 2024 peak. Today, we analyze the Elliott Wave structure behind this powerful breakout. This examination maps a precise path to higher targets. Our technical blueprint reveals a compelling setup driven by strong momentum.
Elliott Wave Analysis
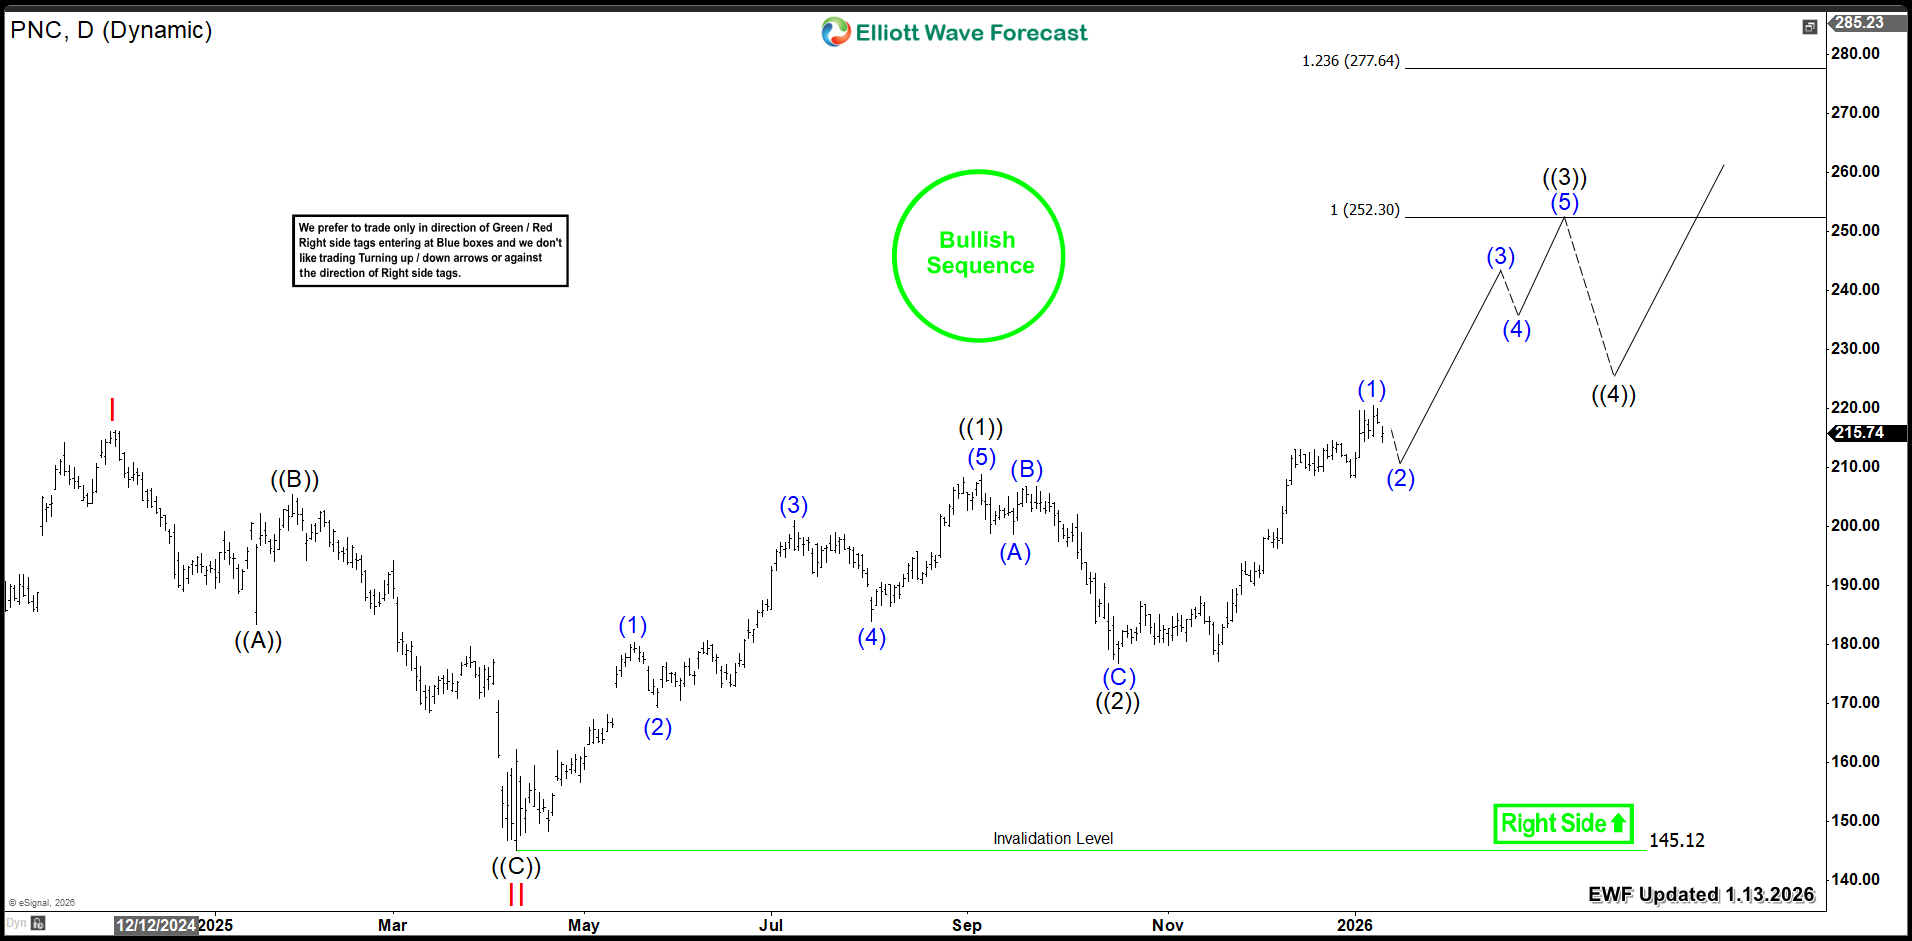
PNC Daily Chart 1.13.2026
Conclusion
PNC’s bullish cycle signals further upside ahead. Therefore, traders should target strategic entries during daily pullbacks.. Apply our Elliott Wave methodology for exact timing. More precisely, enter the market after a 3, 7, or 11-swing correction finishes. Additionally, our proprietary Blue Box system pinpoints high-probability entry zones. Consequently, this disciplined method provides clarity and confidence. Ultimately, it positions traders to capture the next major bullish leg.
Explore our system to gain deeper insights into this methodology.


