Hello traders. Welcome to another trading blog post where we discuss trade setups that the Elliottwave-Forecast members took in recent days. In this one, we will discuss the META stock.
Meta Platforms, formerly Facebook, is a tech company focused on building the “metaverse.” It owns Facebook, Instagram, and WhatsApp, and develops virtual reality (VR) and augmented reality (AR) products. $META is one of the 26 instruments we cover for members in Group 2.
META has now gained over 500% in barely two years, making it one of the most profitable stocks. As technical analysts and traders, what’s more interesting about this rally is the clear higher-high and higher-low sequence. Using Elliott wave terminology, this is a clear impulse wave sequence from October 31, 2024. When in a bullish sequence, we like buying pullbacks in 3, 7, or 11 swings. Likewise, when in a bearish sequence, we like selling bounces in 3, 7, or 11 swings. Trading can be that simple. We like keeping it simple using Elliott wave theory.
On October 3, we shared a blog post about the META ‘buy-the-dip’ setups we traded on September 24. From the entry, the stock rallied over 8.5% to reach a new all-time high, and members reached their full targets. Meanwhile, from the new record high, META started another pullback, opening up a new opportunity for our members to go long again. Let’s check the setup.
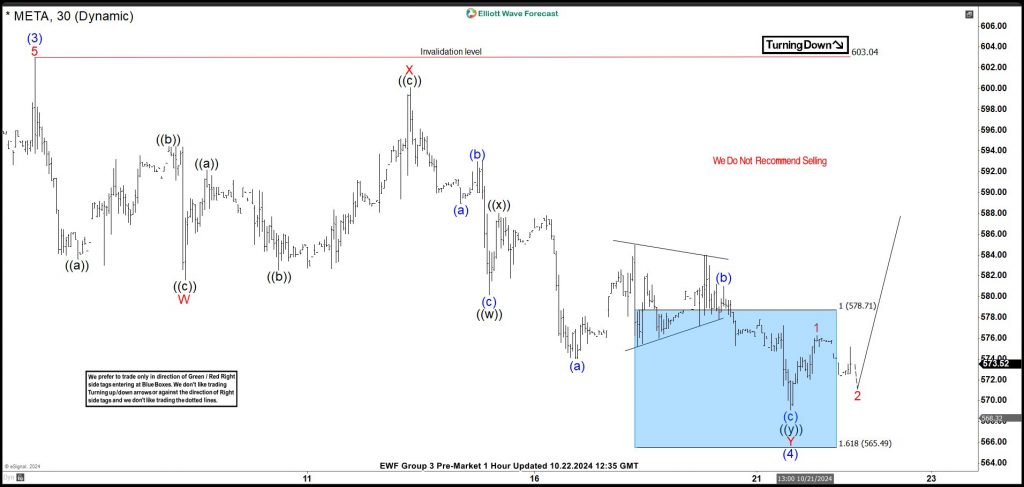
META Elliott Wave Analysis, 10.22.2024
We identified the October 7 high as wave (3) of the impulse sequence from the July 2024 low. Thus, the pullback that followed was to be wave (4). In addition, the pullback emerged as a 7-swing structure. Therefore, we shared the chart above on October 22, 2024, with members, alerting them of a blue box support for wave (4). The blue box covers the 578.71-565.49 price area. We expected the stock to find support and complete wave (4) within the blue box. As a result, wave (5) should begin, or the price should make at least a 3-swing bounce.
We added a long position from 578.71 with a stop slightly below 565.49 to the trading journal. We intended to close half of the position at the 50% retracement of wave Y of (4).
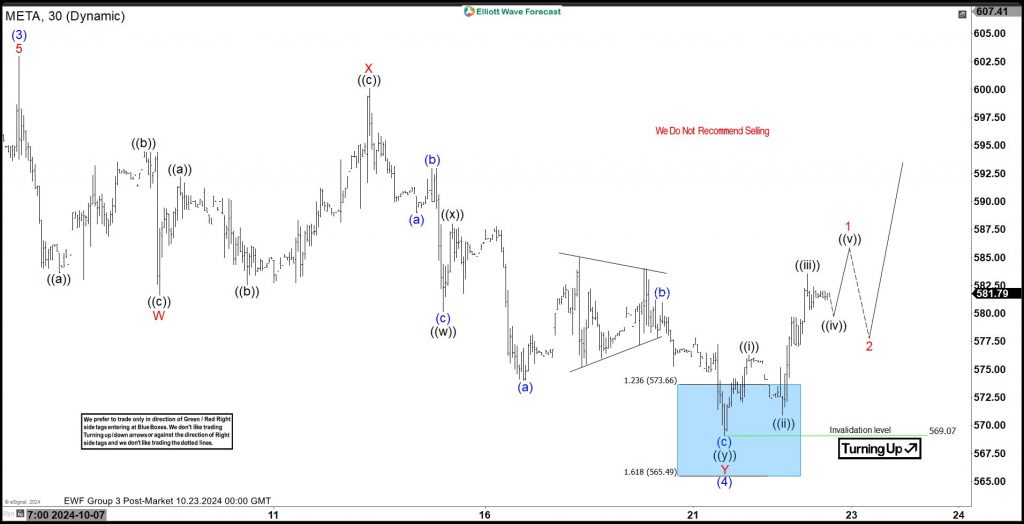
META Elliott Wave Analysis, 10.22.2024
META reacted perfectly from the blue box, as we expected. We shared the chart above with members on October 23, 2024 — a day after the setup. The first reaction from the blue box is an impulse structure for wave 1 of (5). We expect further rallies from the wave 2 minor dip and then wave 3 to break above into a new record high. Alternatively, a 3 or 7 swing bounce may occur instead. This is why we like to close half of the position in profit and adjust the rest to the last pivot low when the price reaches 50% of the 3rd leg of the pullback, as we have in this case. This way, we can take the risk off the table in case the price is not as ambitious to the upside as we are.
We will continue to monitor the development of META and the other 77 instruments we cover, providing 24-hour updates to members.
About Elliott Wave Forecast
At www.elliottwave-forecast.com, we update one-hour charts four times daily and four-hour charts once daily for all 78 instruments. We also conduct daily live sessions to guide clients on the right side of the market. Additionally, we have a chat room where moderators answer market-related questions. Experience our service with a 14-day trial for only $9.99. Cancel anytime by contacting us at support@elliottwave-forecast.com.
Back


