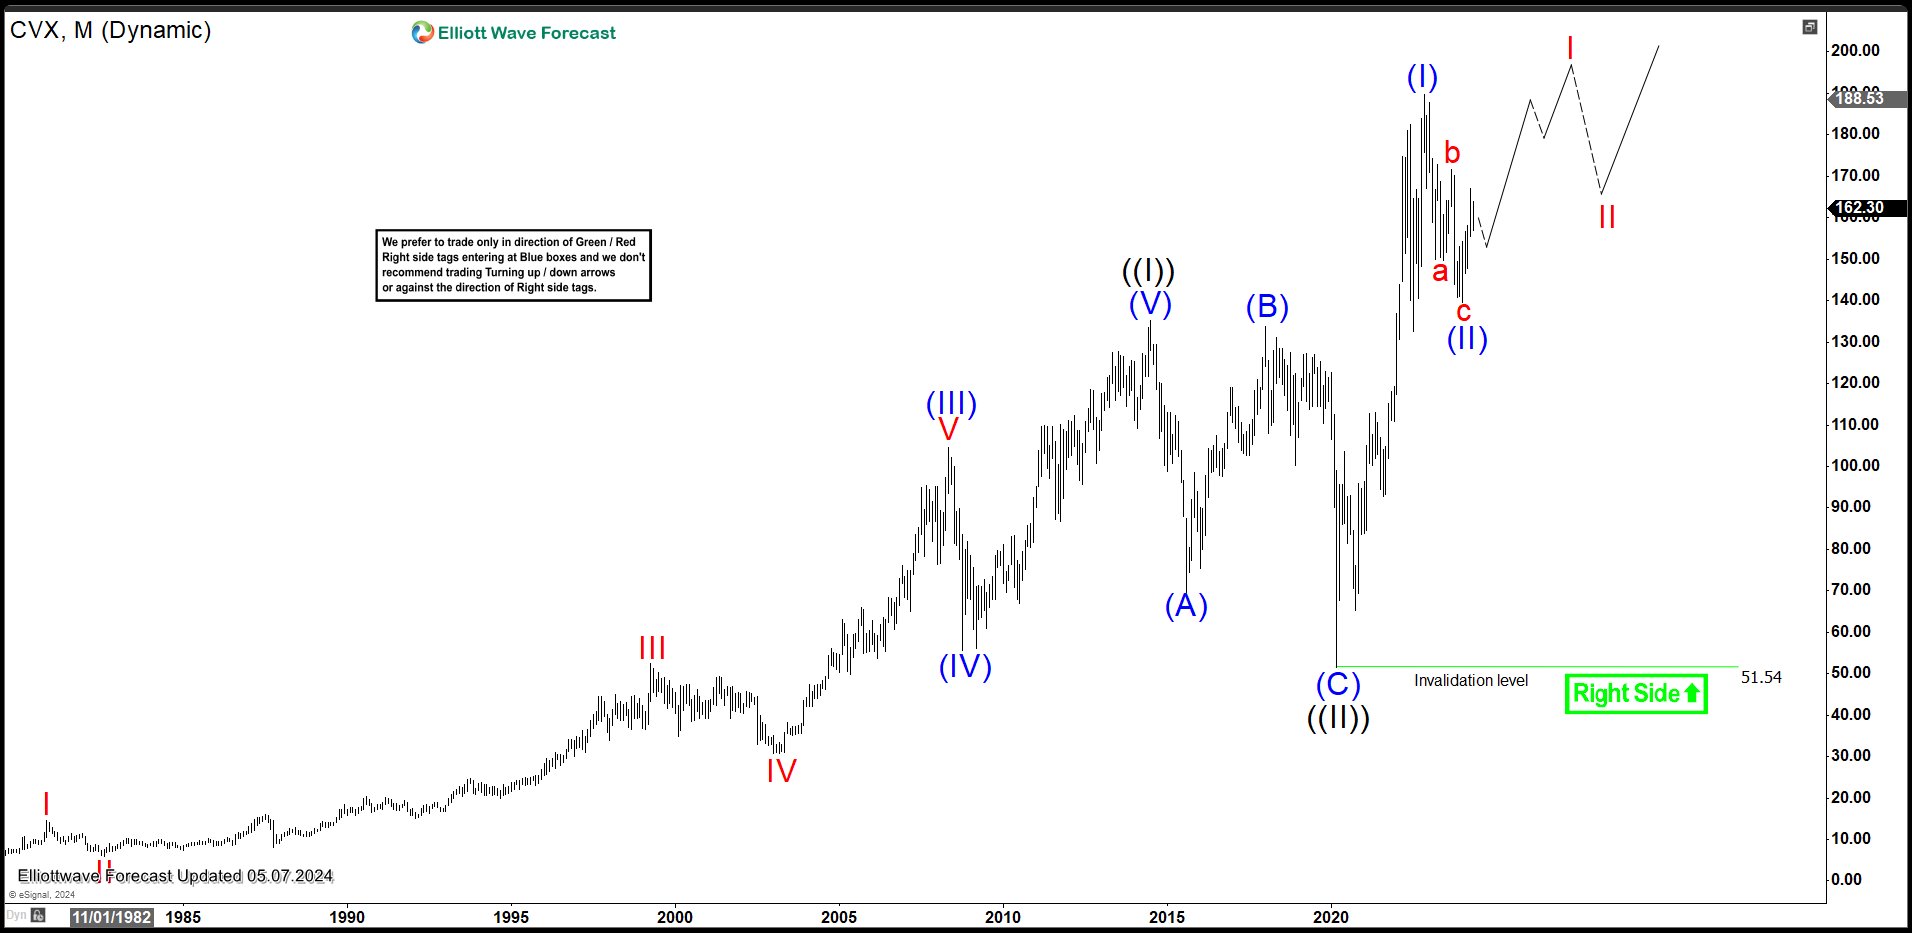
Chevron Monthly Elliott Wave Chart
Monthly Elliott Wave Chart of Chevron (CVX) above shows rally to 135.1 ended wave ((I)). wave ((II)) pullback took the form of a zigzag Elliott Wave structure. Down from wave ((I)), wave (A) ended at 69.58. The stock then rallied in wave (B) towards 133.88. Wave (C) lower resumed lower towards 51.54 which completed wave ((II)) in higher degree. Wave ((III)) higher is currently in progress as an impulsive structure. Up from wave ((II)), wave (I) ended at 182.4. Pullback in wave (II) ended as a zigzag structure at 139.62 and the stock has resumed higher. As far as pivot at 51.54 low stays intact, expect the stock to extend higher.
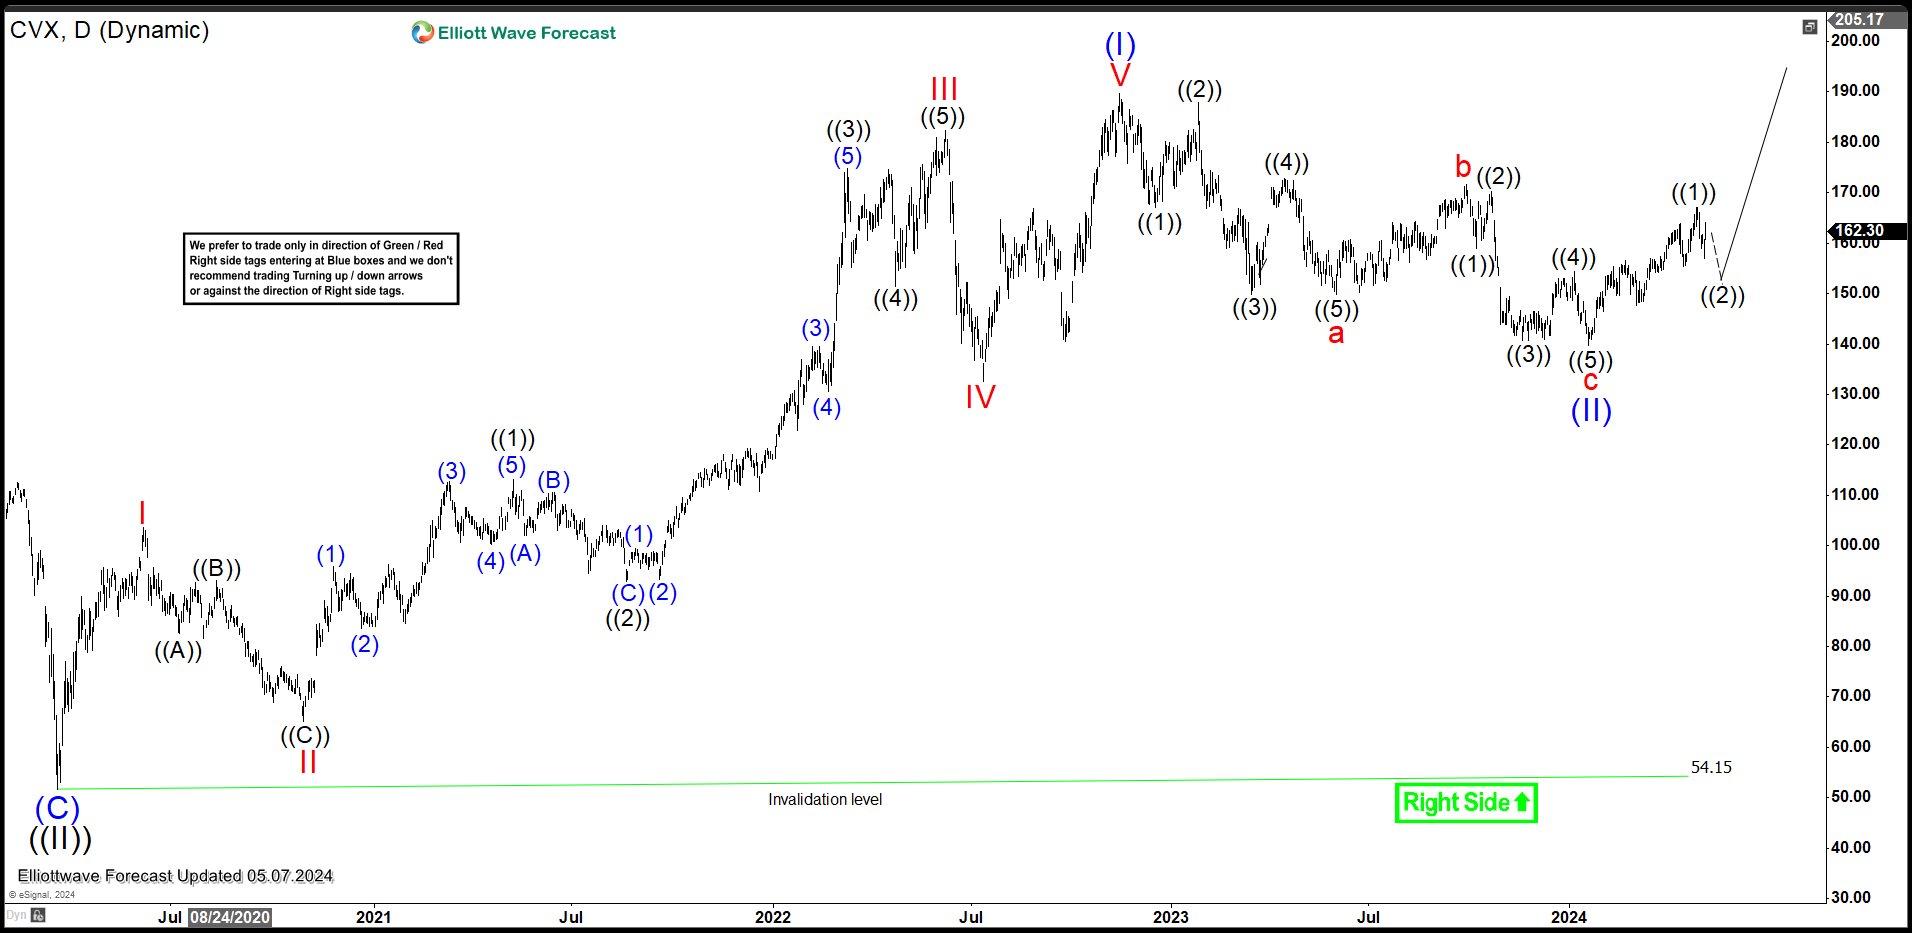
Chevron Daily Elliott Wave Chart
Daily Elliott Wave Chart for Chevron above shows that wave (I) rally ended at 182.4. Pullback in wave (II) has also ended at 139.62 and the stock has resumed higher. Up from wave (II), wave ((1)) ended at 167.11. Expect wave ((2)) pullback to stay above 139.62 for further upside. Near term, as far as pivot at 139.62 low and more importantly pivot at 54.15 low stays intact, expect the stock to extend higher.
If you’d like to get regular updates on other stocks, ETF, forex, and commodities, feel free to take our trial here –> 14 days Trial
Back


