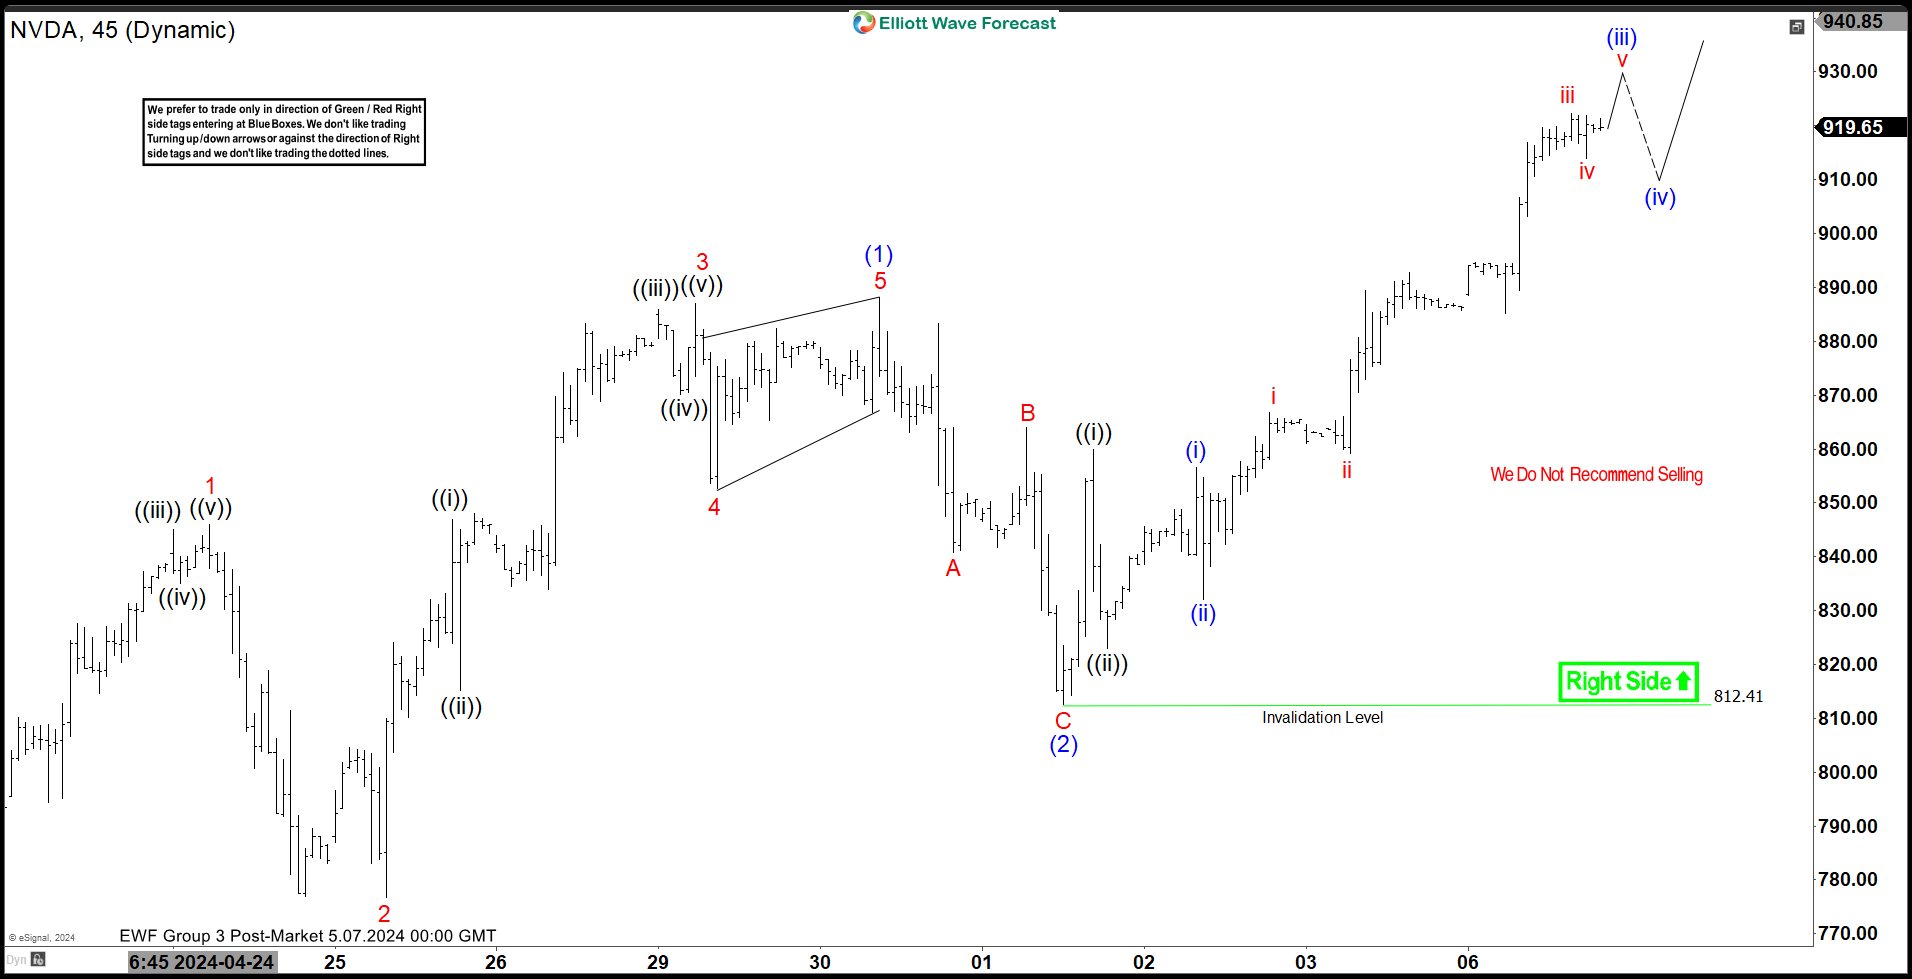
Short Term Elliott Wave View on Nvidia (NVDA) suggests the stock ended correction on 4.20.2024 at 756.06. From there, the stock starts a new impulsive rally. Up from 4.20.2024, wave 1 ended at 846.07 and pullback in wave 2 ended at 776.80. The stock extends higher in wave 3 towards 887 and dips in wave 4 ended at 852.66. FInal leg wave 5 ended at 888.19 which completed wave (1) in higher degree. The stock then pullback in wave (2) with internal subdivision as a zigzag Elliott Wave structure. The stock has resumed higher in wave (3).
Up from wave (2), wave ((i)) ended at 860 and dips in wave ((ii)) ended at 823. The stock then nested higher with wave (i) ended at 856.6 and pullback in wave (ii) ended at 832. Wave i of (iii) ended at 866.84 and dips in wave ii of (iii) ended at 859.17. Stock resumed higher in wave iii of (iii) towards 922.2 and pullback in wave iv of (iii) ended at 910.31. Expect the stock to extend higher 1 more leg to end wave v of (iii). Afterwards, it should pullback in wave (iv) to correct cycle from 5.2.2024 low before it resumes higher again. Near term, as far as pivot at 812.4 low stays intact, expect pullback to find support in 3, 7, or 11 swing for further upside.


