Double Three (WXY) Corrective Structure
 Found Buyers at the Blue Box Area as Expected.")
$XLV 1H Elliott Wave Chart 2.13.2024:
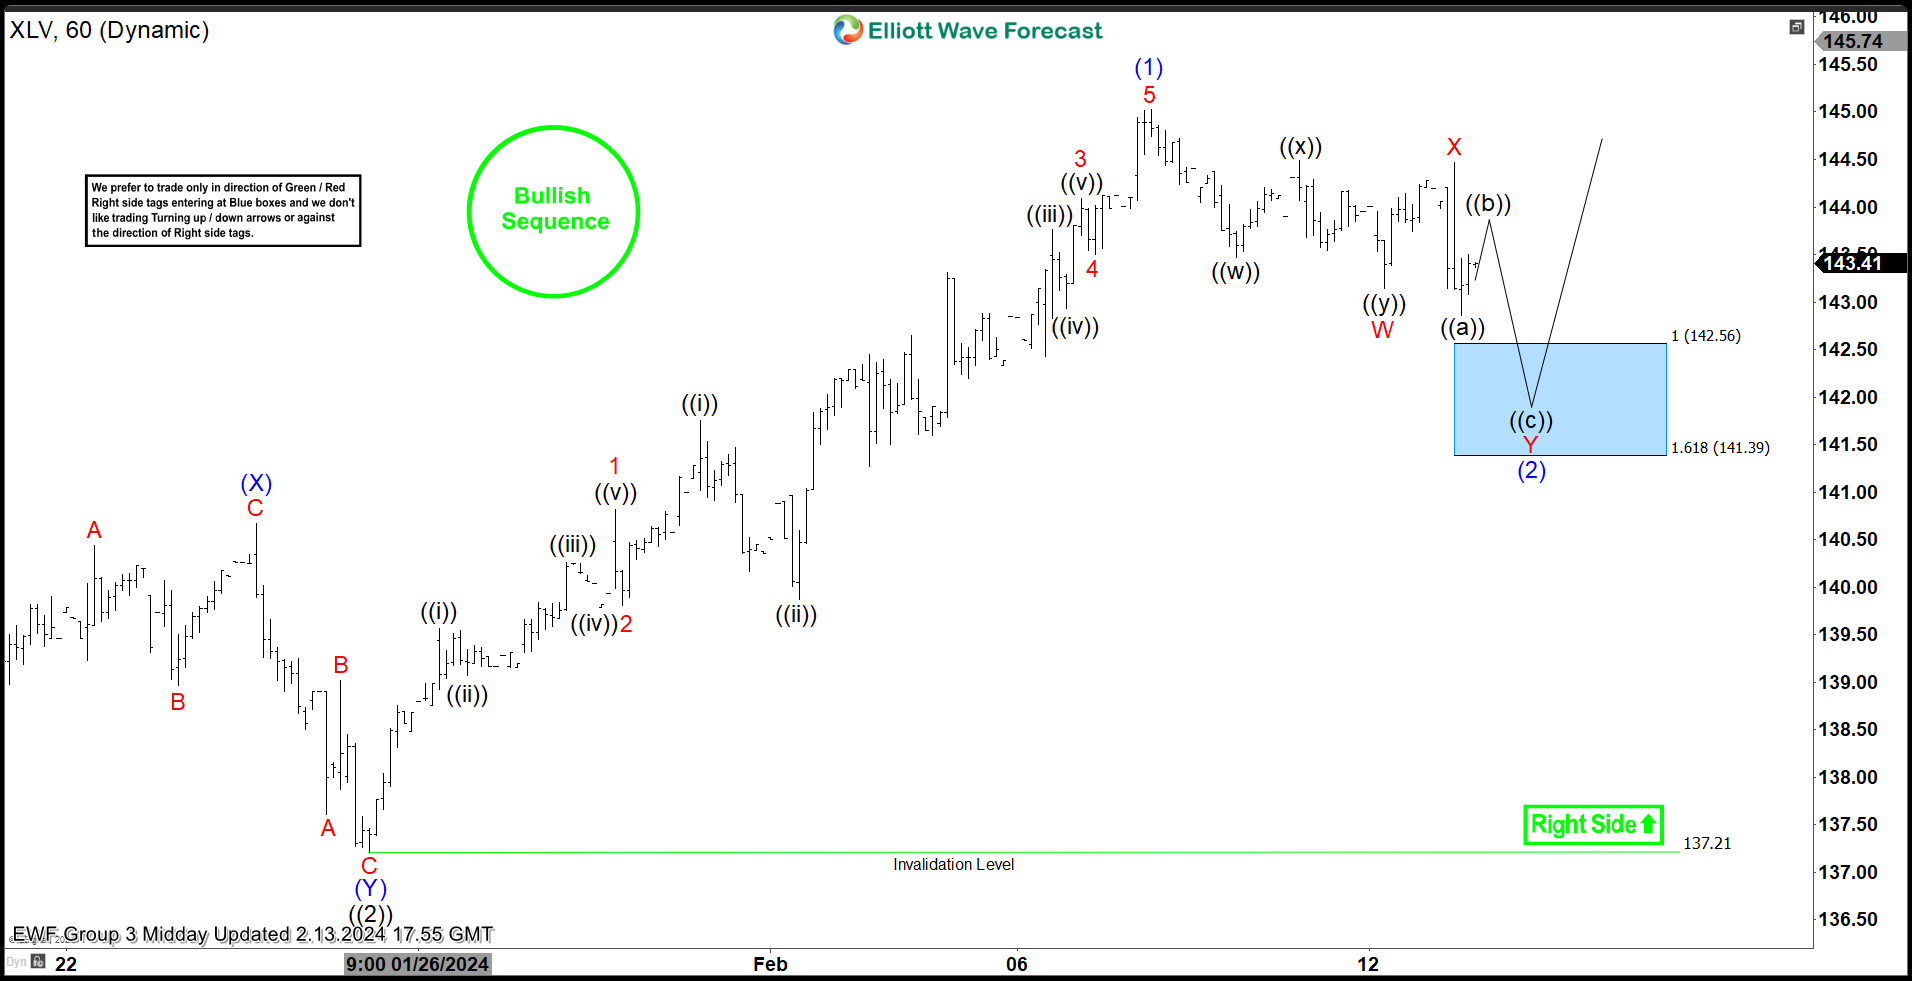 Here is the 1H Elliott Wave count from 2.13.2024. We expected the pullback to find buyers at the blue box area at 142.56 – 141.39 in a 7 swing structure (WXY).
$XLV 1H Elliott Wave Chart 2.16.2024:
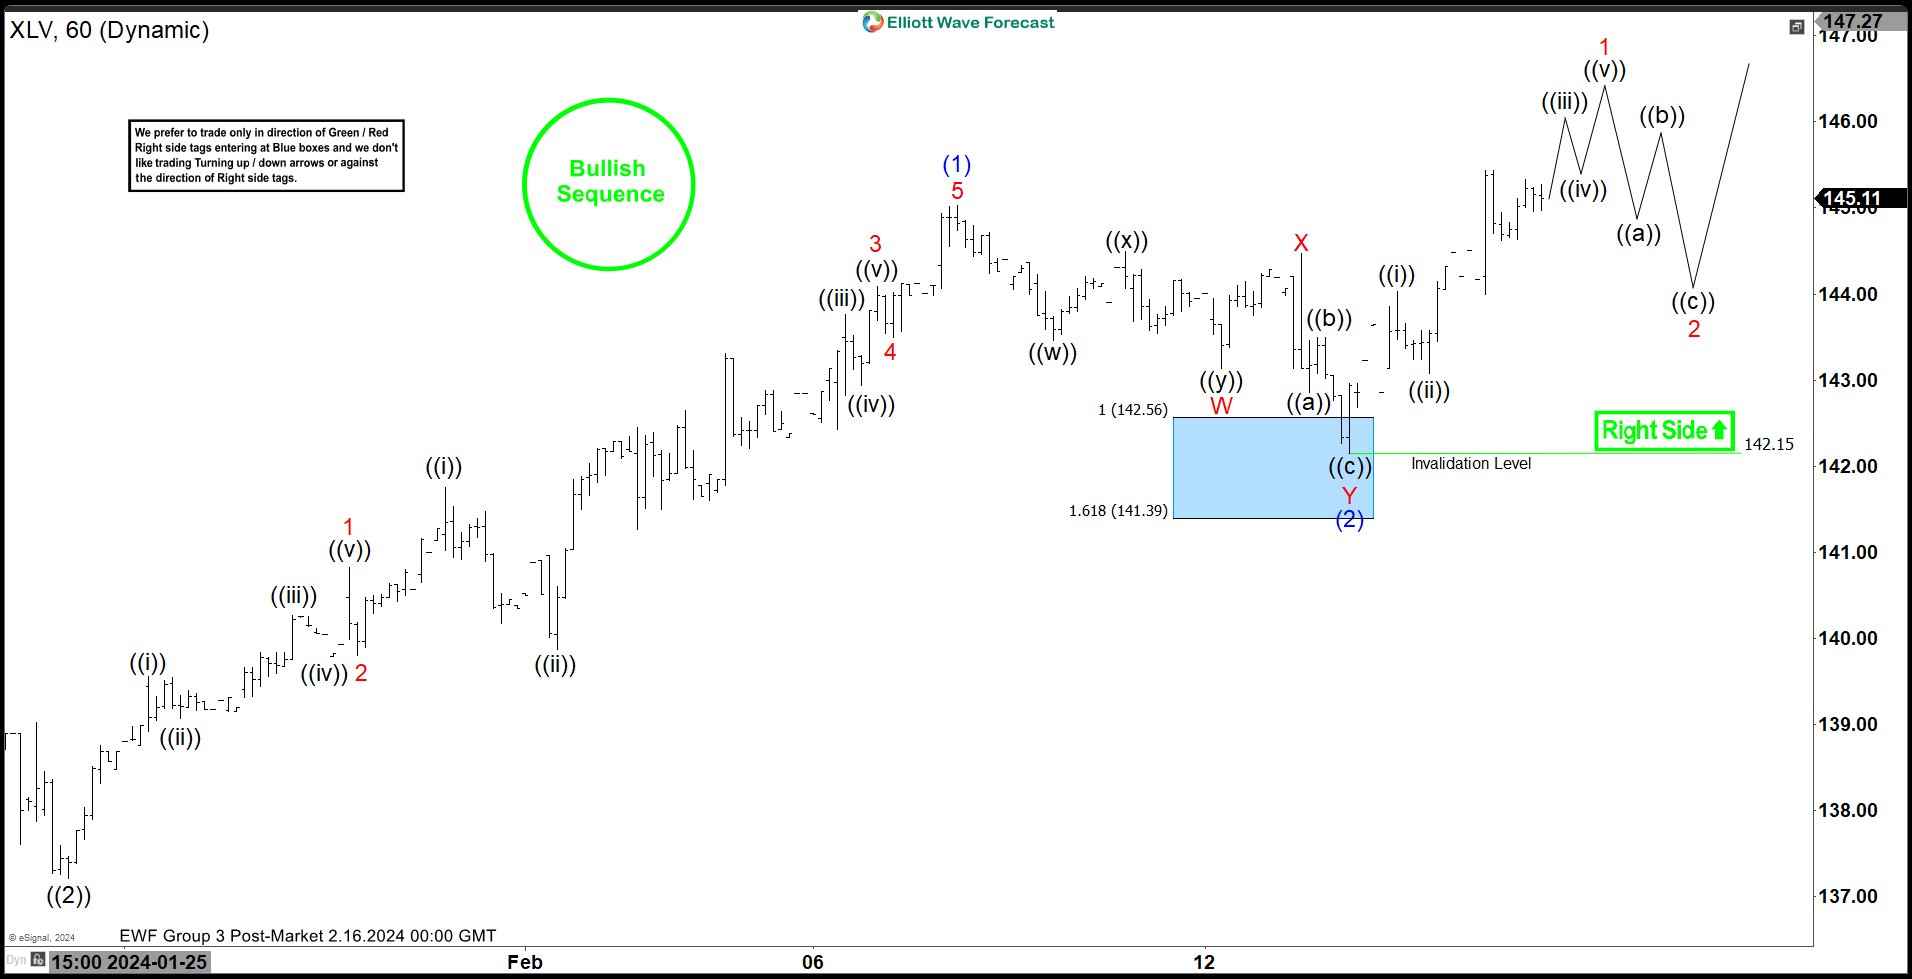 Here is the 1H update few days later from 2.16.2024 showing the bounce taking place as expected. The ETF reacted higher from the blue box after doing a Double Three correction allowing longs to get a risk free position. The stock is expected to remain supported towards $156 – 168 before another pullback can happen.
Elliott Wave Forecast
We cover 78 instruments, but not every chart is a trading recommendation. We present Official Trading Recommendations in the Live Trading Room. If not a member yet, Sign Up for Free 14 days Trial now and get access to new trading opportunities.
Welcome to Elliott Wave Forecast!


