Zigzag (ABC) Corrective Structure
 Found Buyers After a Zigzag Pullback.")
$AMD 1H Elliott Wave Chart 1.26.2024:
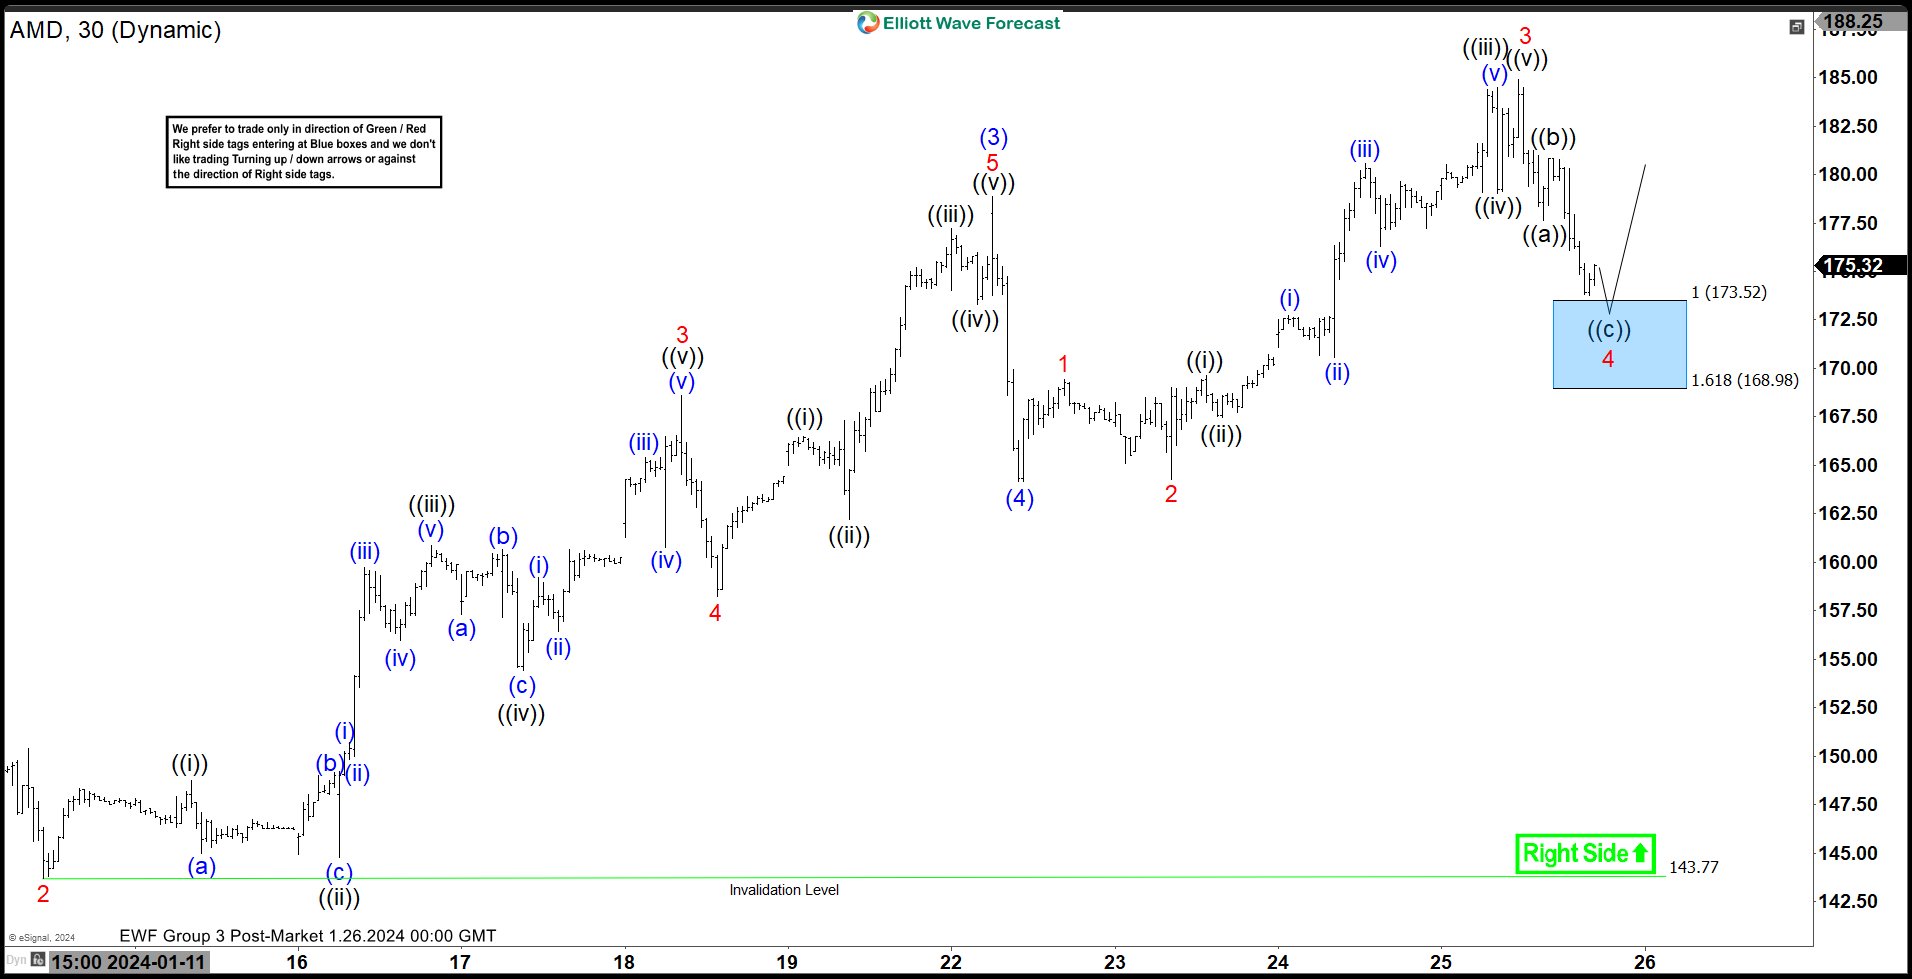 Here is the 1H Elliott Wave count from 1.26.2024. We expected the pullback to find buyers at the blue box area at 173.52 – 168.98 in a 3 swing structure (ABC).
$AMD 1H Elliott Wave Chart 1.28.2024:
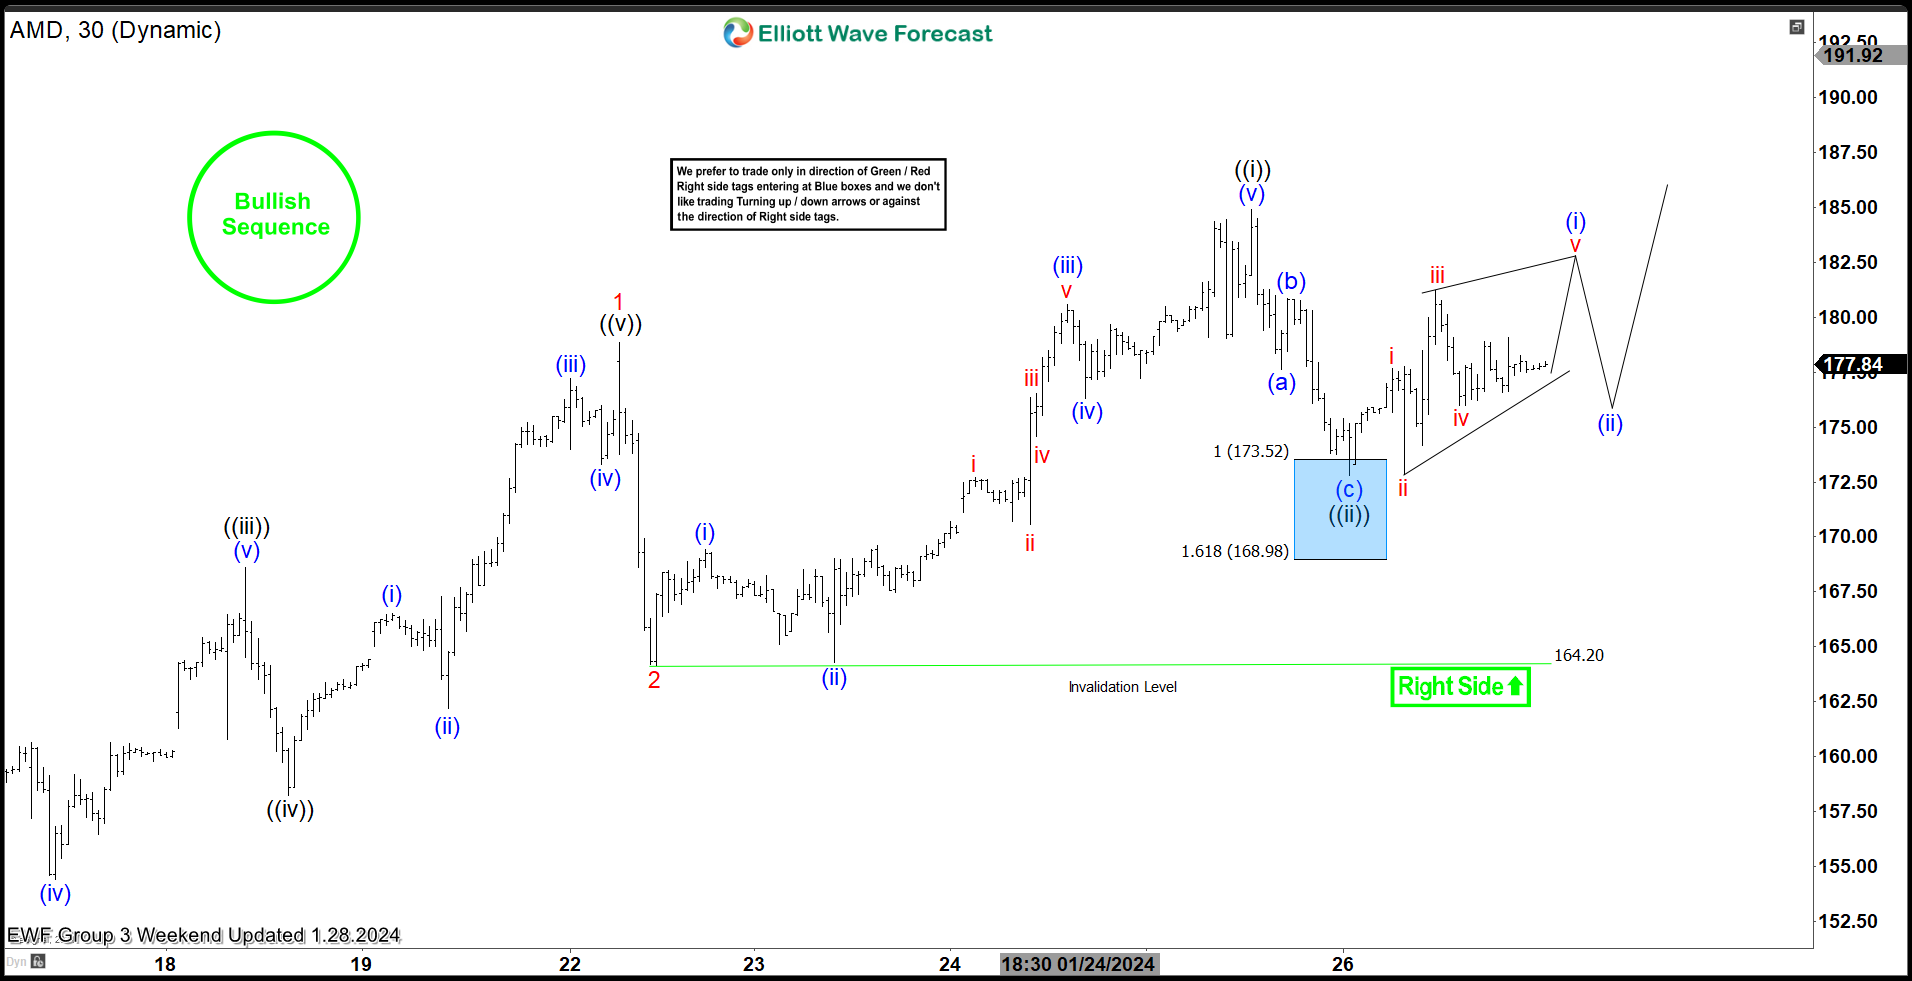 Here is the 1H update 2 days later from 1.28.2024 showing the bounce taking place as expected. The stock reacted higher from the blue box after doing a Zigzag correction allowing longs to get a risk free position.
Elliott Wave Forecast
We cover 78 instruments, but not every chart is a trading recommendation. We present Official Trading Recommendations in the Live Trading Room. If not a member yet, Sign Up for Free 14 days Trial now and get access to new trading opportunities.
Welcome to Elliott Wave Forecast!


