Ford Motor Company is an American multinational automobile manufacturer headquartered in Dearborn, Michigan, United States. It was founded by Henry Ford and incorporated on June 16, 1903. The company sells automobiles and commercial vehicles under the Ford brand, and luxury cars under its Lincoln luxury brand.
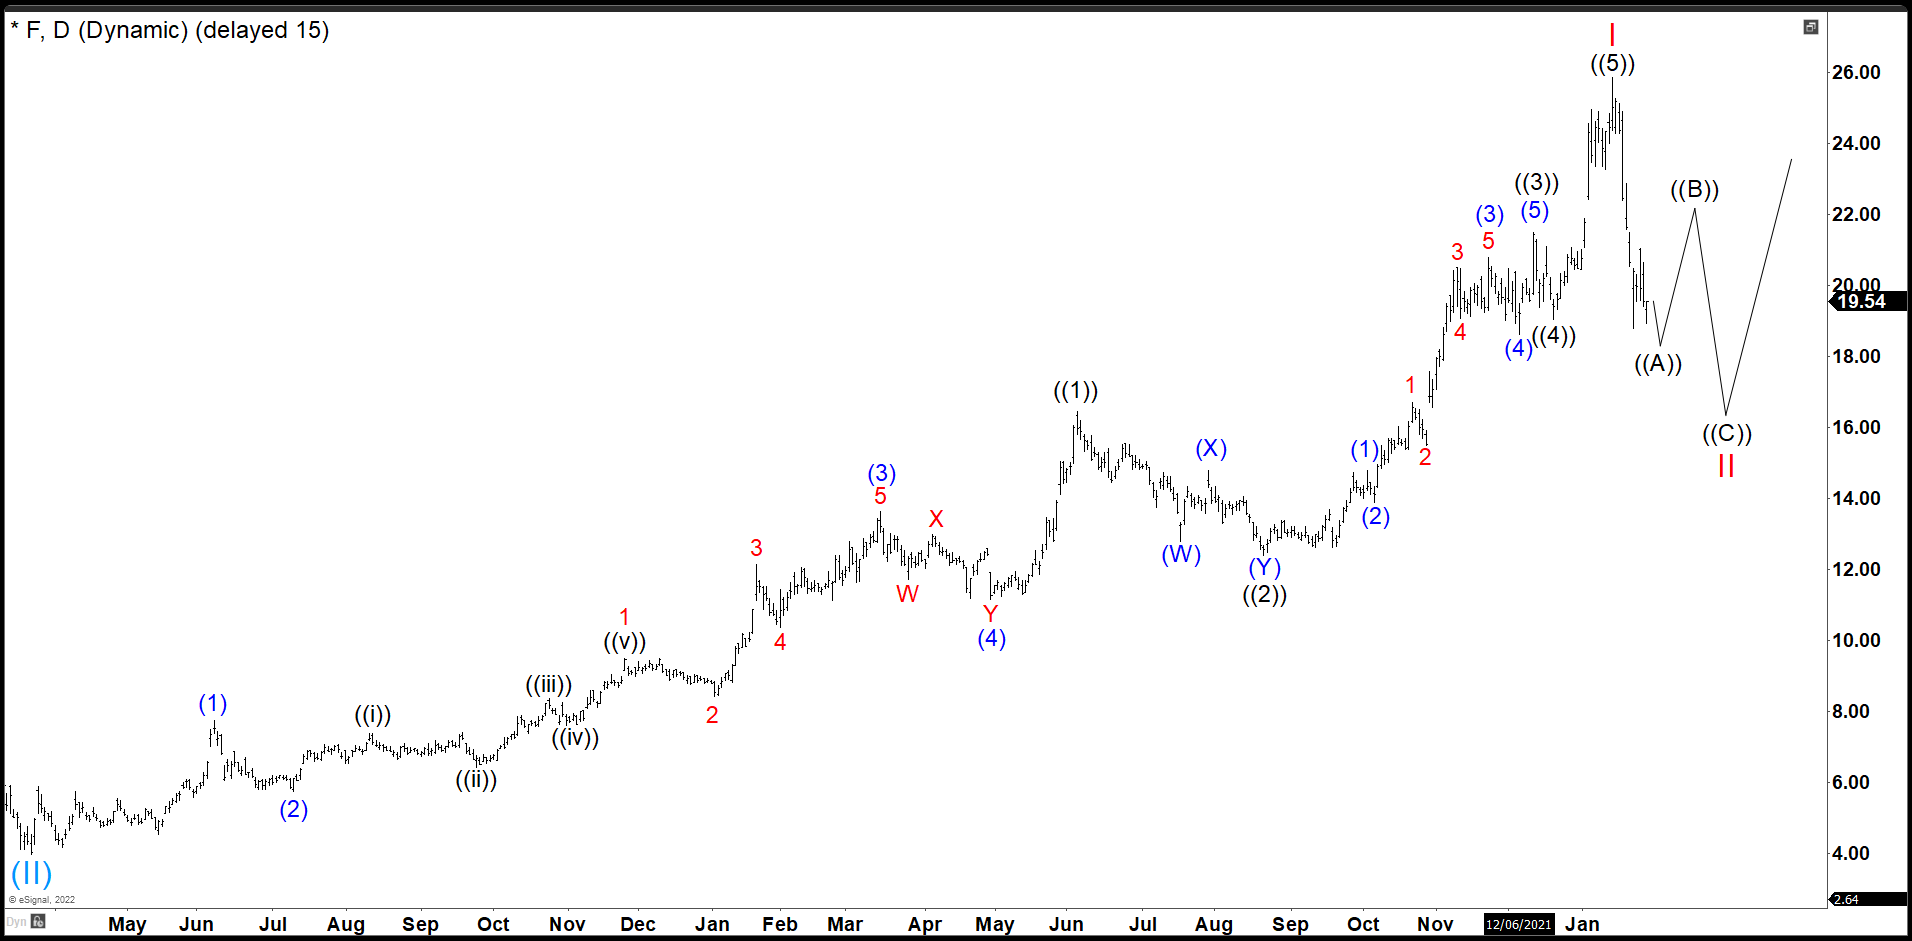
FORD January 30th Daily Chart
Ford started a rally from March 2020 low after covid19 crash. From there, we can see 5 waves up forming an Impulse Structure ending on January 13th 2022. (If you want to learn more about Elliott Wave Theory, please follow these links: Elliott Wave Education and Elliott Wave Theory). Wave ((1)) ended an impulse structure at 16.45. Then Ford corrected in 3 swings making a double correction structure, ending wave ((2)) at 12.38. Another rally resumed from the low completing wave ((3)) at 21.49 and pullback again making a flat correction ended wave ((4)) at 19.05. Then, we can see last push higher completing wave ((5)) and wave I at 25.87. After peak, the stock dropped strongly losing more than 27% building an impulse structure. We called a zig zag correction to take place before continue higher.
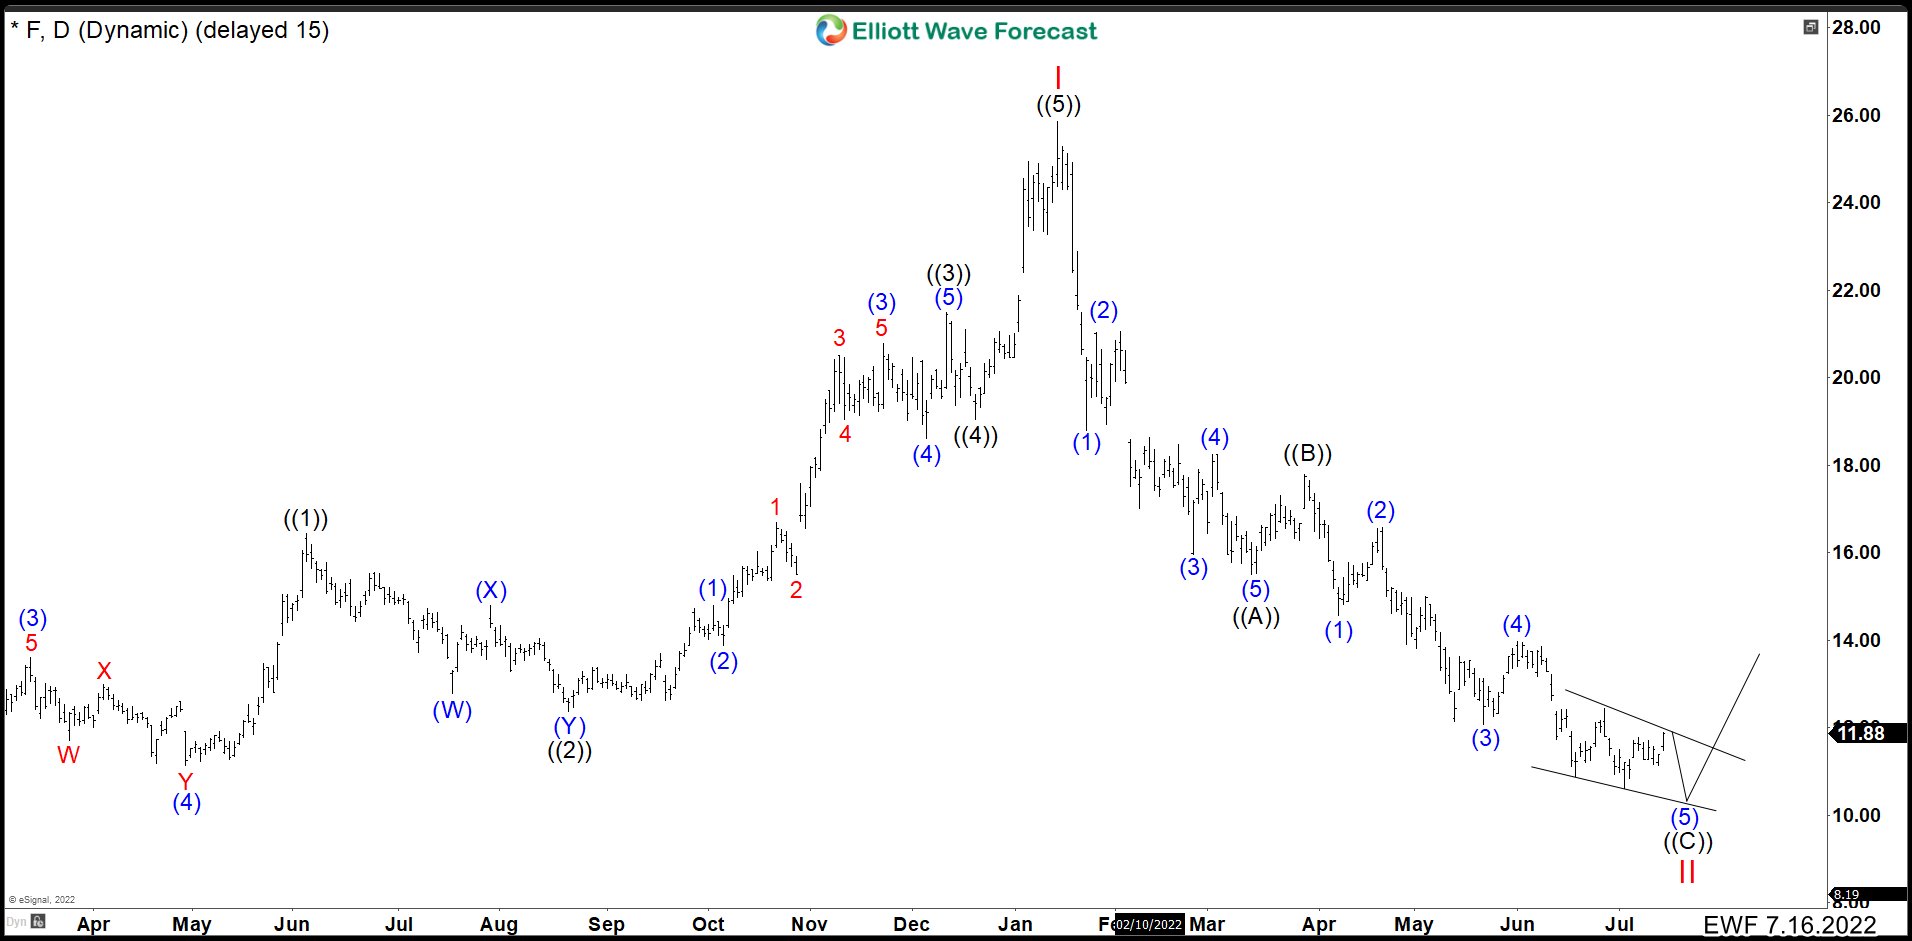
FORD July 15th Daily Chart
The expected wave ((A)) continued extending lower building 5 waves at 15.51. The bounce from here was too shallow, but at the end was wave ((B)) finishing at 17.83. The downtrend followed and it looks like is developing a 5 waves structure again as a wave ((C)) of a zig zag correction. Down from wave ((B)), wave (1) ended at 14.54 and wave (2) rally at 16.56. Then we could see 5 swings more ending wave (3) 12.06. Pullback as wave (4) finished at 13.98 and now we looking to complete wave (5). This last wave has taken the form as a ending diagonal. To complete this structure we need one more low below 10.62. Once broken the last low, we should end the wave (5) of ((C)) of II and continue with the rally again or 3 swings higher at least. A break of 12.43, but more important 13.98, the correction as wave II could be over.
Take 14 Days Trial
Elliottwave Forecast updates one-hour charts 4 times a day and 4-hour charts once a day for all our 78 instruments. We do a daily live session where we guide our clients on the right side of the market. In addition, we have a chat room where our moderators will help you with any questions you have about what is happening in the market.
Let’s trial 14 days for only $9.99 here: I want 14 days trial. Cancel Any time.


