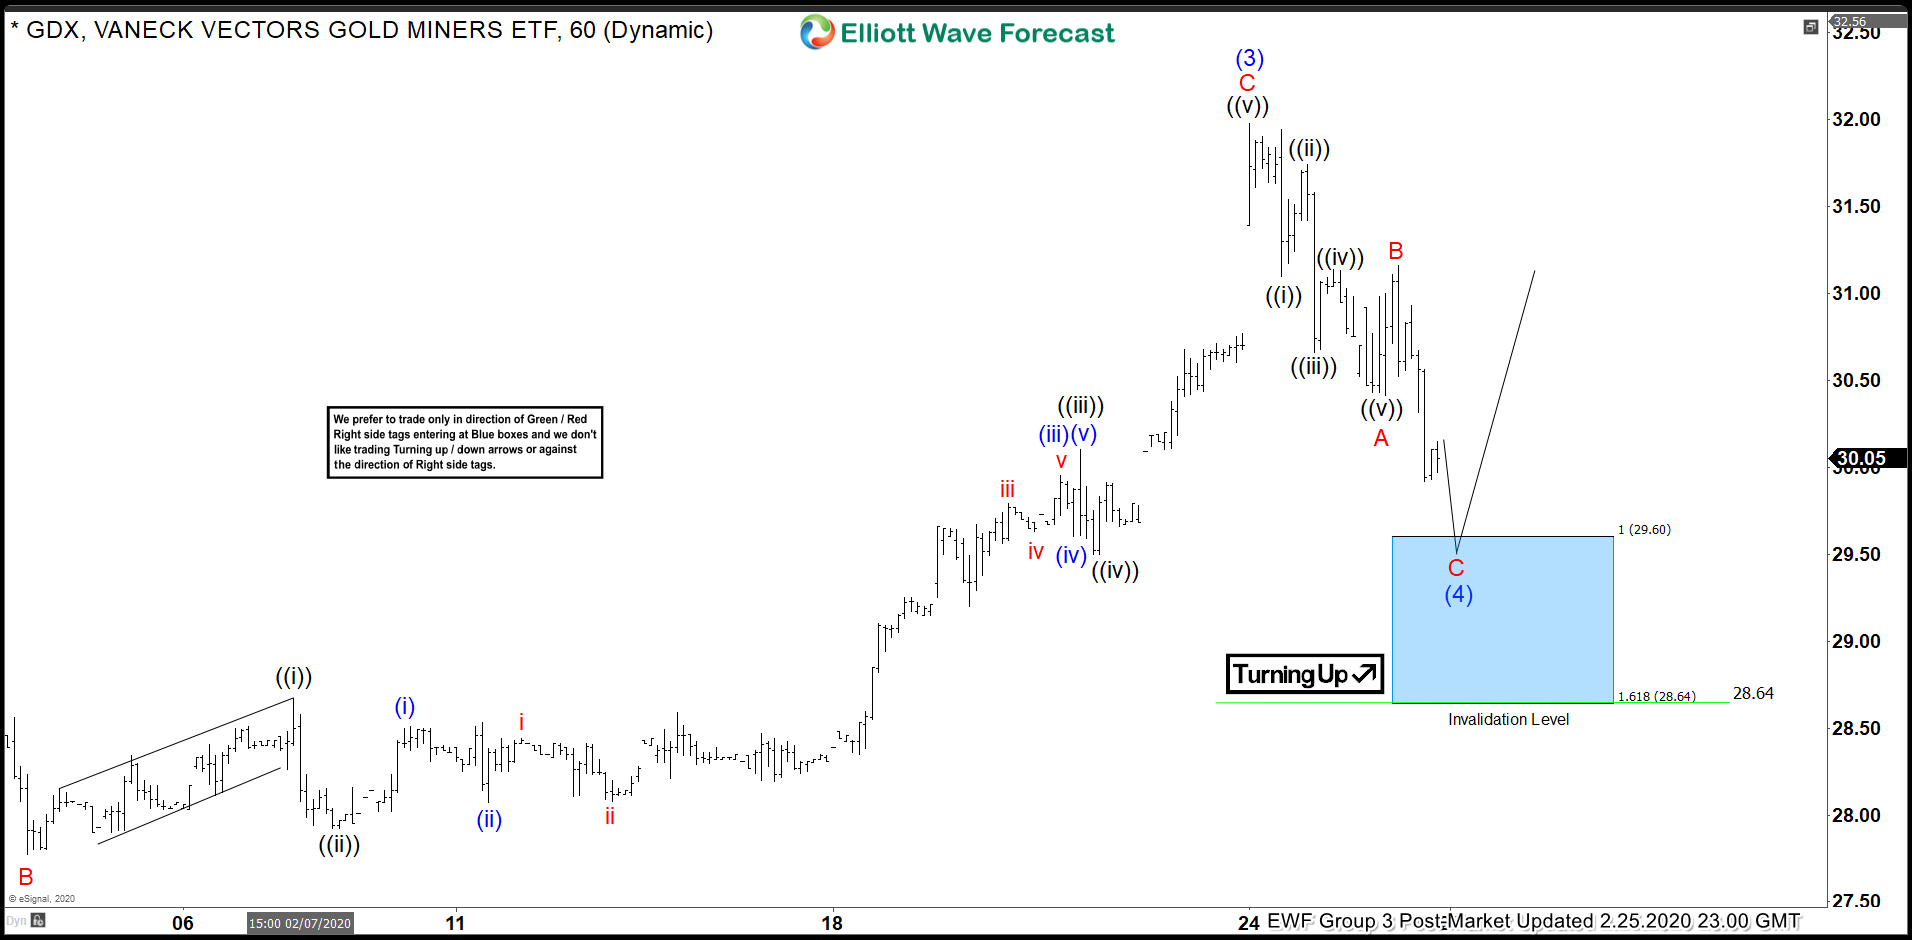
Short term Elliott wave view in GDX ETF suggests the rally from January 14, 2020 low in wave (3) has ended at 31.98 high. The cycle unfolded as a 5 waves impulse Elliott Wave structure. Up from January 14 low, wave ((i)) ended at 28.67 and pullback in wave ((ii)) ended at 27.92. The ETF resumed higher in wave ((iii)) which ended at 30.10. After that, wave ((iv)) pullback ended at 29.50 and the final leg wave ((v)) of C ended at 31.98.
Currently, the ETF is correcting that cycle in wave (4). The correction is unfolding as a zig-zag. Wave A of (4) has ended at 30.41 and subdivides in lesser degree 5 waves. Wave ((i)) of A ended at 31.10 and wave ((ii)) ended at 31.74. The ETF then continued lower in wave ((iii)), which ended at 30.66. Then, the bounce in wave ((iv)) ended at 31.14. The push lower in wave ((v)) ended at 30.41. From there, the ETF then bounced in wave B, which ended at 31.16. Potential area to end wave C of (4)) is 100% – 161.8% Fibonacci extension from February 24 high which comes at 28.64 – 29.60 area. From this area, GDX can then extend higher or at least bounce in 3 waves.


