Citigroup (NYSE: C) is currently up $34 year-to-date and the stock is still aiming for further gains before year-end as the financial sector continues the recovery from last year correction.
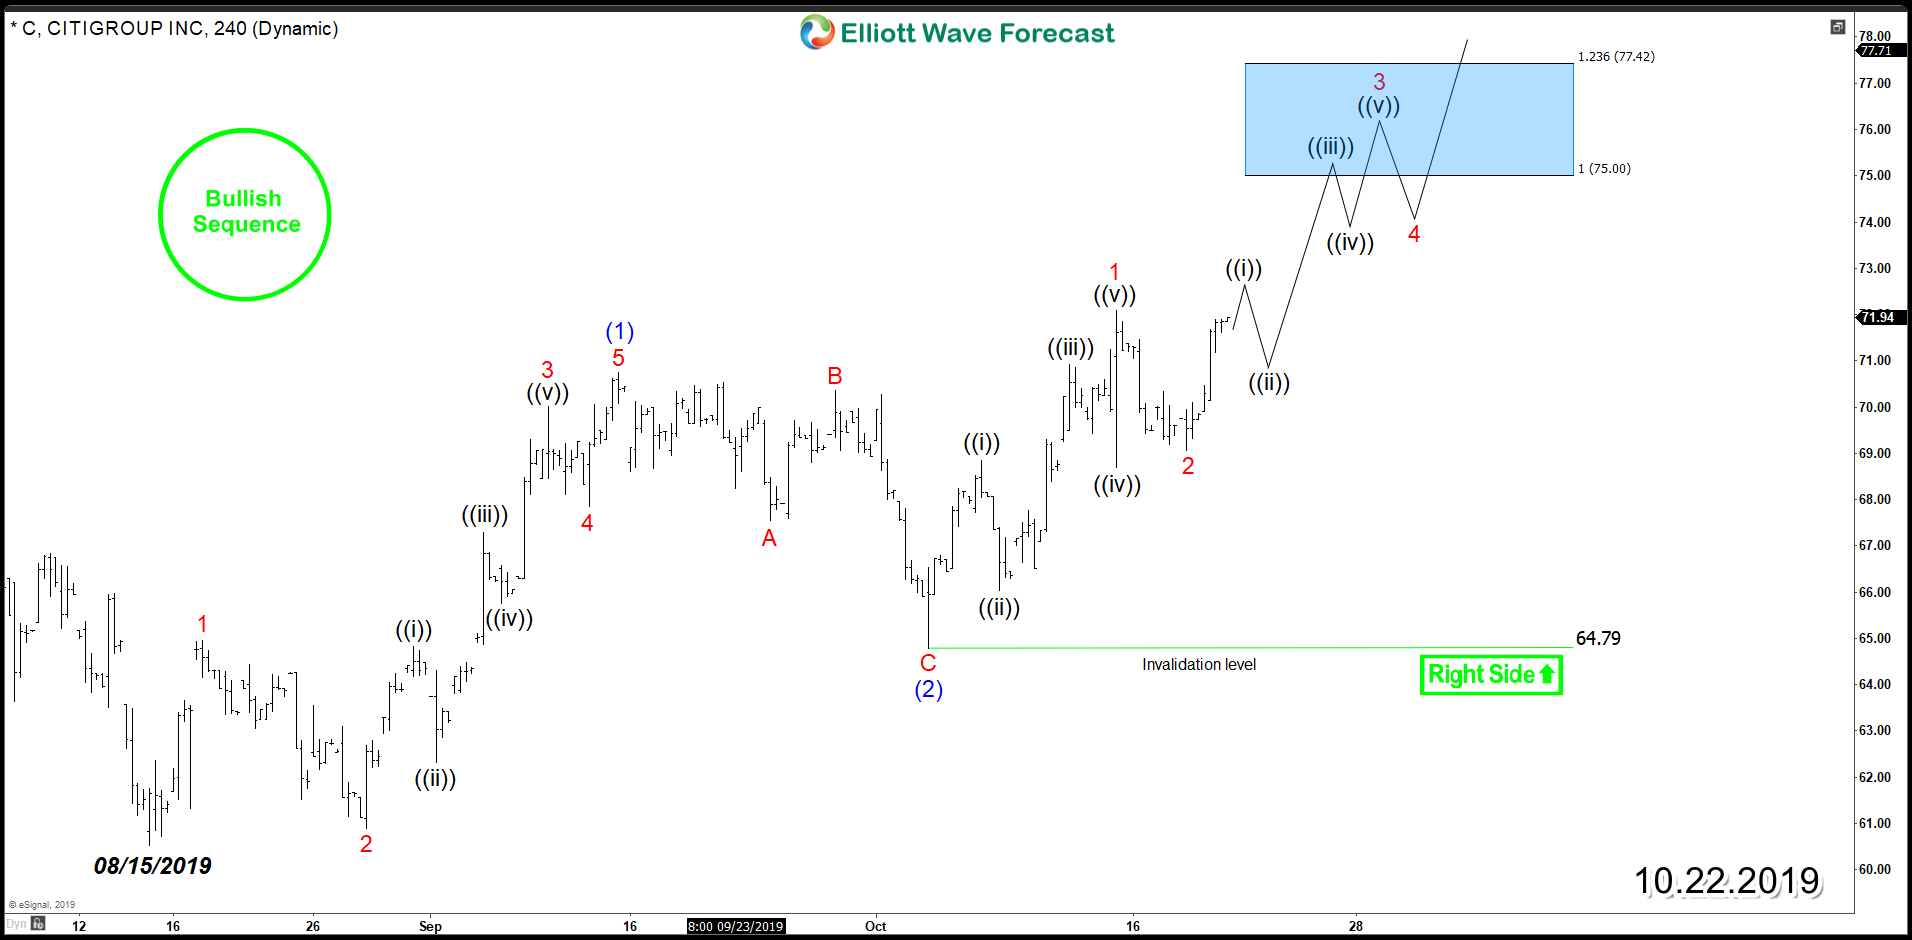
The recent impulsive rally from 10.03.2019 low allowed the stock to break above September 2019 peak which opened a bullish sequence from August low and aiming for a target higher at equal legs area $75 – $77. The short term pullbacks are expected to find buyers in 3 or 7 swings against $64.7 low for the stock to continue higher within a bullish nest. An impulsive 5 waves move can have an extended 3rd wave which can be reflected on Citigroup move if the stock exceeds 1.618 Fib extension area $81.
Citigroup 4H Chart
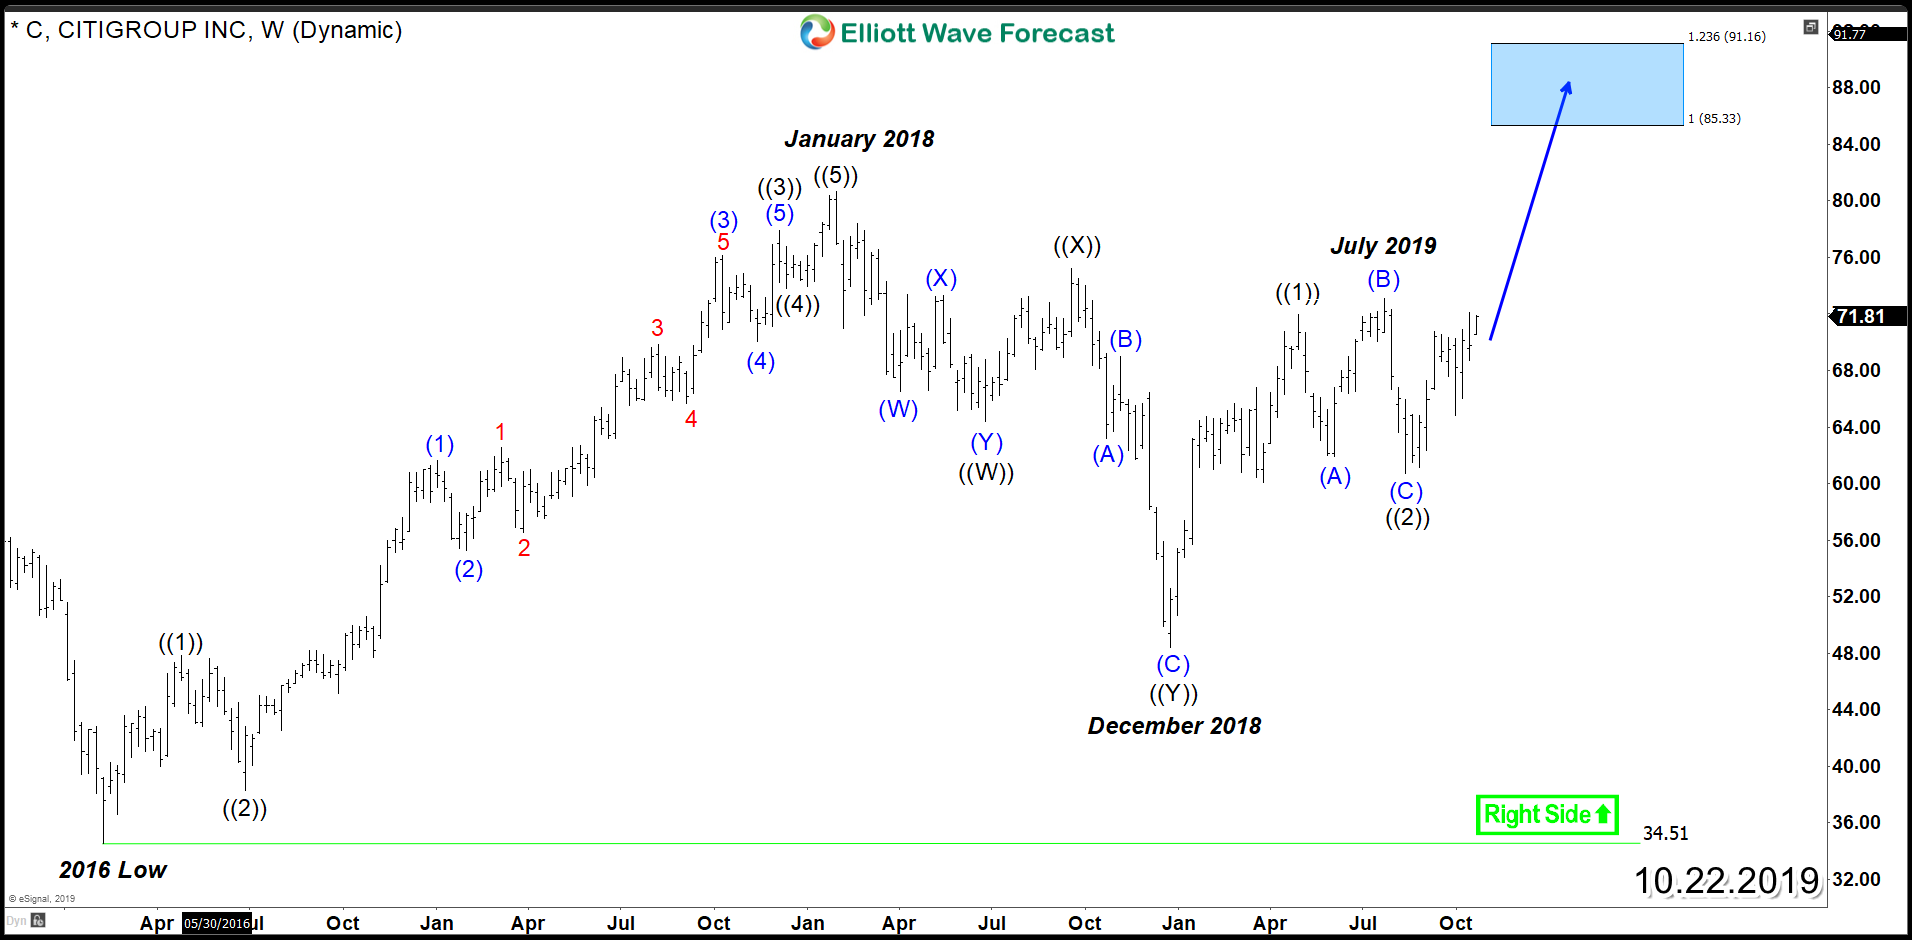
The move to the upside will trigger a chain of a higher high sequence which will eventually takes the previous peak of July 2019 and January 2018 as the next target will be around 100% Fibonacci extension $85 – $91. A break above 2018 peak is the key for the stock to open further continuation within cycle from 2016 low as bulls will take control again.
Citigroup Weekly Chart
Get more insights about the Financial Sector and learn how to trade our blue boxes using the 3, 7 or 11 swings sequence by trying out our services 14 days . You will get access to our 78 instruments updated in 4 different time frames, Live Trading & Analysis Session done by our Expert Analysts every day, 24-hour chat room support and much more.


