Reserve Bank of Australia (RBA) made a surprise cut of 25 bps earlier today, taking the interest rate to a record low of 1.75%. Before the meeting, analysts have put the probability of a rate cut as much as 50-50 after the dismal figure of CPI last Tuesday April 26. The CPI report last week showed that for the first time since 2008, consumer prices fell by 0.2% qoq, suggesting a deflation. Excluding volatile items such as fuel and food, the core inflation rate comes at 0.15% qoq. This is equivalent to an annualized 1.55% rate, which is still well below RBA’s target of 2 – 3%. RBA Governor Glenn Stevens specifically pointed the weak inflation data as the reason for the rate cut. He also mentions while global economy continues to grow, the growth was at slower pace than expected and forecasts have been revised down further.
Immediate reaction of the move by RBA is a selloff in the Australian Dollar today. So has the currency turned lower now? What’s the medium term outlook? Although most economists expect RBA to cut another 25 bps before the end of the year, the bank likely would want to wait for the quarterly inflation figure due in August before deciding the next move.
Technical Analysis
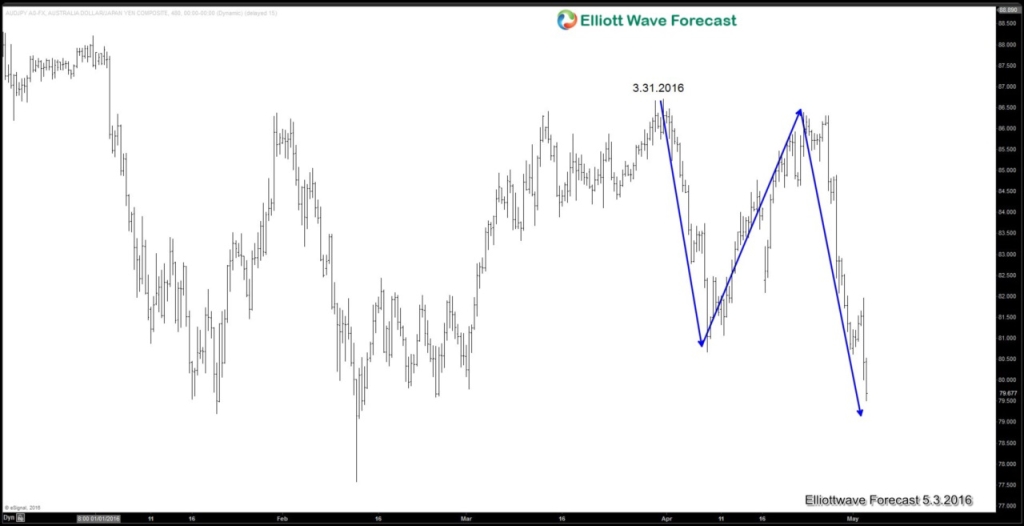
4 Hour $AUDJPY
4 Hour chart of $AUDJPY above suggests that pair made a 3 swing move from 3.31.2016. Although short term, pair can still make another marginal low, cycle from 3.31.2016 is expected to end soon and pair can start correcting 3.31 cycle at least in 3 waves, suggesting that AUD may find at least a temporary low soon.
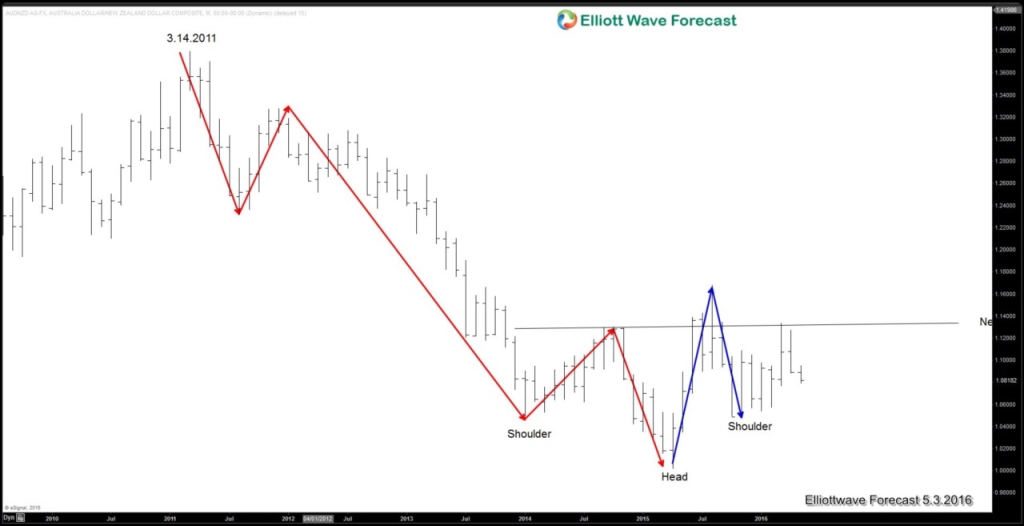
Weekly $AUDNZD
AUDNZD Weekly chart above shows a 5 waves move from 3.14.2011 peak. So far the rebound looks to be in 2 swing and another swing higher is possible. The pair is also showing what looks to be a weekly inverse Head and Shoulder. Overall this suggests AUD may not be as weak as it looks, or another interpretation suggests that NZD will be even weaker than AUD in the medium / long term
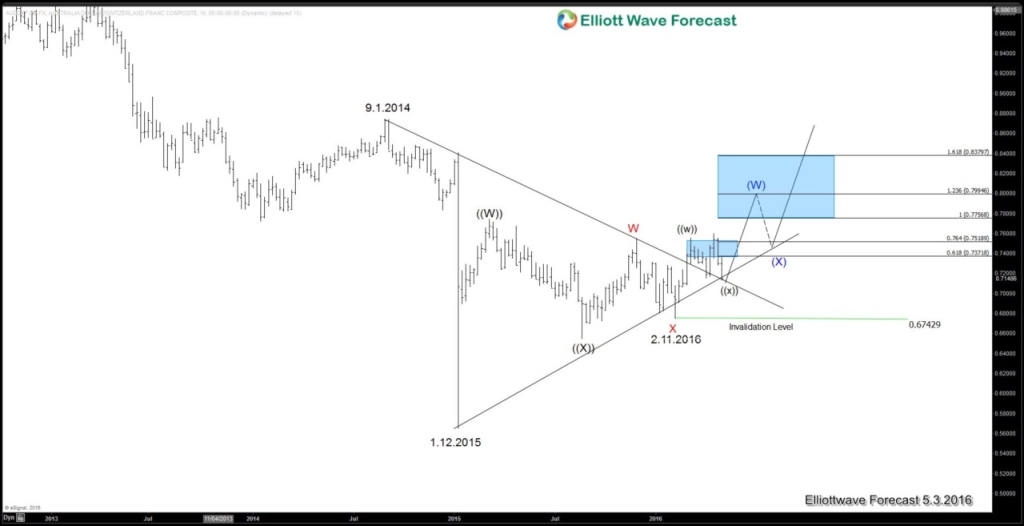
Weekly $AUDCHF
Weekly $AUDCHF chart above shows the pair breaks above the trend line resistance coming from 9.1.2014 peak. It sold off today, retesting the same trend line that turns into support. In addition, it also has another trend line support coming from 1.12.2015 low. As far as pair does not close below the broken trend line again in weekly basis and as far as pivot at 0.6742 (2.11.2016) is intact, pair can resume higher towards 0.7756 – 0.80
Conclusion
Despite the strong selloff in Australian Dollar after the RBA news event, when looking at several AUD charts, in particular $AUDJPY, $AUDNZD, and $AUDCHF, the currency may not be as weak as it looks. We would like to try playing this pullback in the Australian Dollar with $AUDCHF and favor more upside to 0.7756 as far as the pair does not close below the broken weekly trend line from 9.1.2014, and as far as the pivot at 0.6742 stays intact.
If you enjoy this article, feel free to read other technical articles at our Technical Blogs and also check Chart of The Day. For further information on how to find levels to trade $AUDUSD, $AUDJPY, $AUDNZD or other forex pairs, indices, and commodities using Elliottwave, take our FREE 14 Day Trial. We provide Elliott Wave chart in 4 different time frames, up to 4 times a day update in 1 hour chart, two live sessions by our expert analysts, 24 hour chat room moderated by our expert analysts, market overview, and much more! With our expert team at your side to provide you with all the timely and accurate analysis, you will never be left in the dark and you can concentrate more on the actual trading and making profits.
Back


