ServiceNow (NYSE: NOW) is an American software company based in Santa Clara, California that develops a cloud computing platform to help companies manage digital workflows for enterprise operations. The stock doubled in price in recent year and with a strong performance investors are piling up to buy it as Cloud computing industry is booming and attracting new players into the space.
Based on the Elliott Wave Theory, we will define the current structure taking place within the daily cycle and predict what the market is looking for in the future.
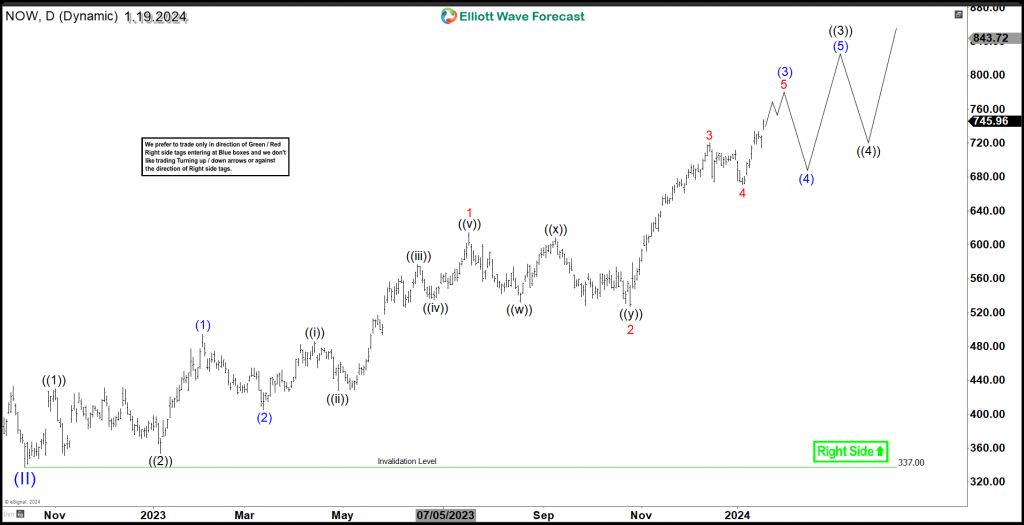
Now Daily Chart 1.19.2024
Since October 2022 low, NOW clearly established a nesting structure within an impulsive cycle to the upside and it’s already passed the phase of the strongest rally in wave 3. The current move is proposed to be wave 5 of (3) and within the coming weeks a 3 waves pullback in wave (4) is expected to take place. Furthermore, any type of pullback is expected to remain corrective in 3 , 7 or 11 swings for the stock to maintain the bullish trend.
During the recent rally, NOW managed to break into new all time highs above 2021 peak and created a new weekly bullish sequence. The weekly target for the stock will be coming at equal legs area $1022 – $1445 and therefore the stock will remain supported above $337 until that target is reached.
In mid-term, as the stock is entering the final phase of the 2022 cycle where choppy price action can be seen with series of 4th & 5th waves taking place, short term buyers should be cautious and investors would be advised to look for the next daily correction in wave II as a long term opportunity.
The following video offers a daily outlook based on Now’s Elliott Wave analysis within daily and weekly cycle :
Back


