Hello Traders! Today, we will look at the Daily Elliott Wave structure of Adobe Inc. ($ADBE) and explain why the stock should soon reach a Blue Box area and react higher.
Adobe Inc. is an American multinational computer software company incorporated in Delaware and headquartered in San Jose, California. It has historically specialized in software for the creation and publication of a wide range of content, including graphics, photography, illustration, animation, multimedia/video, motion pictures, and print.
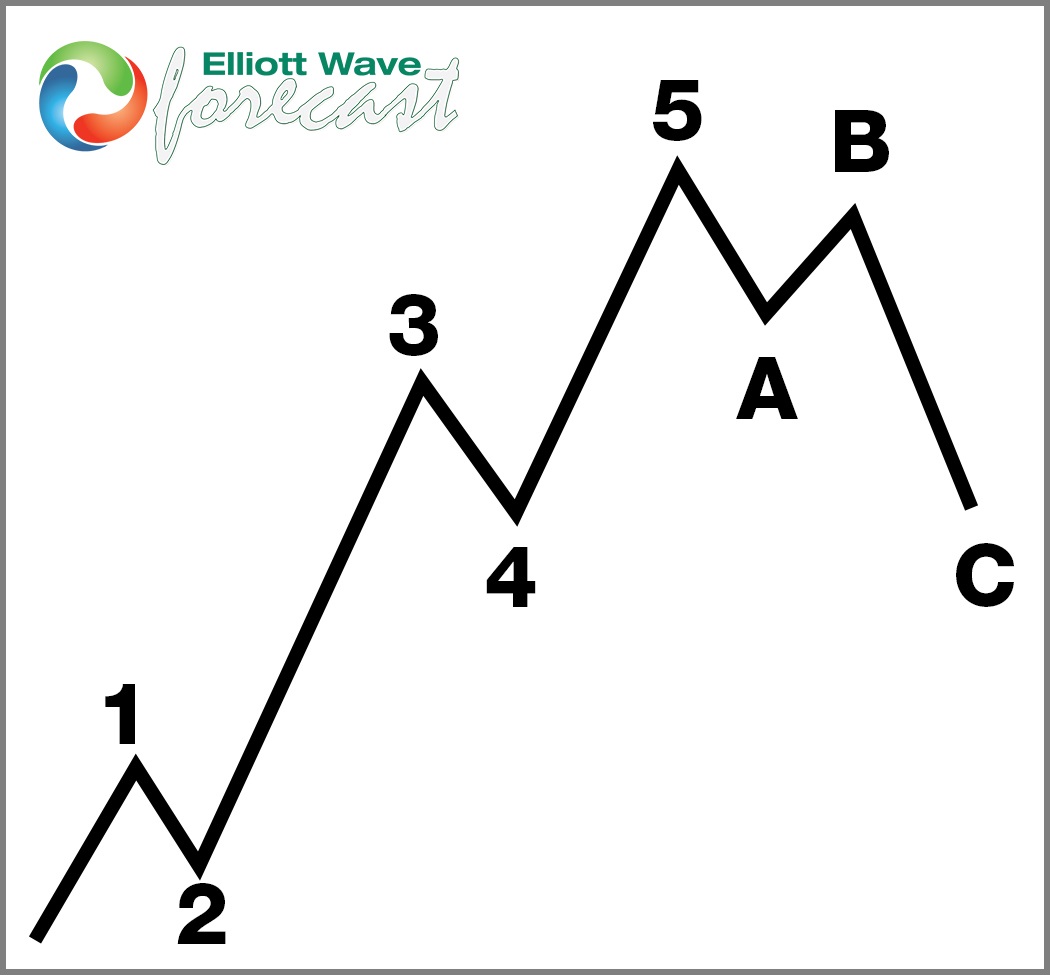
5 Wave Impulse Structure + ABC correction
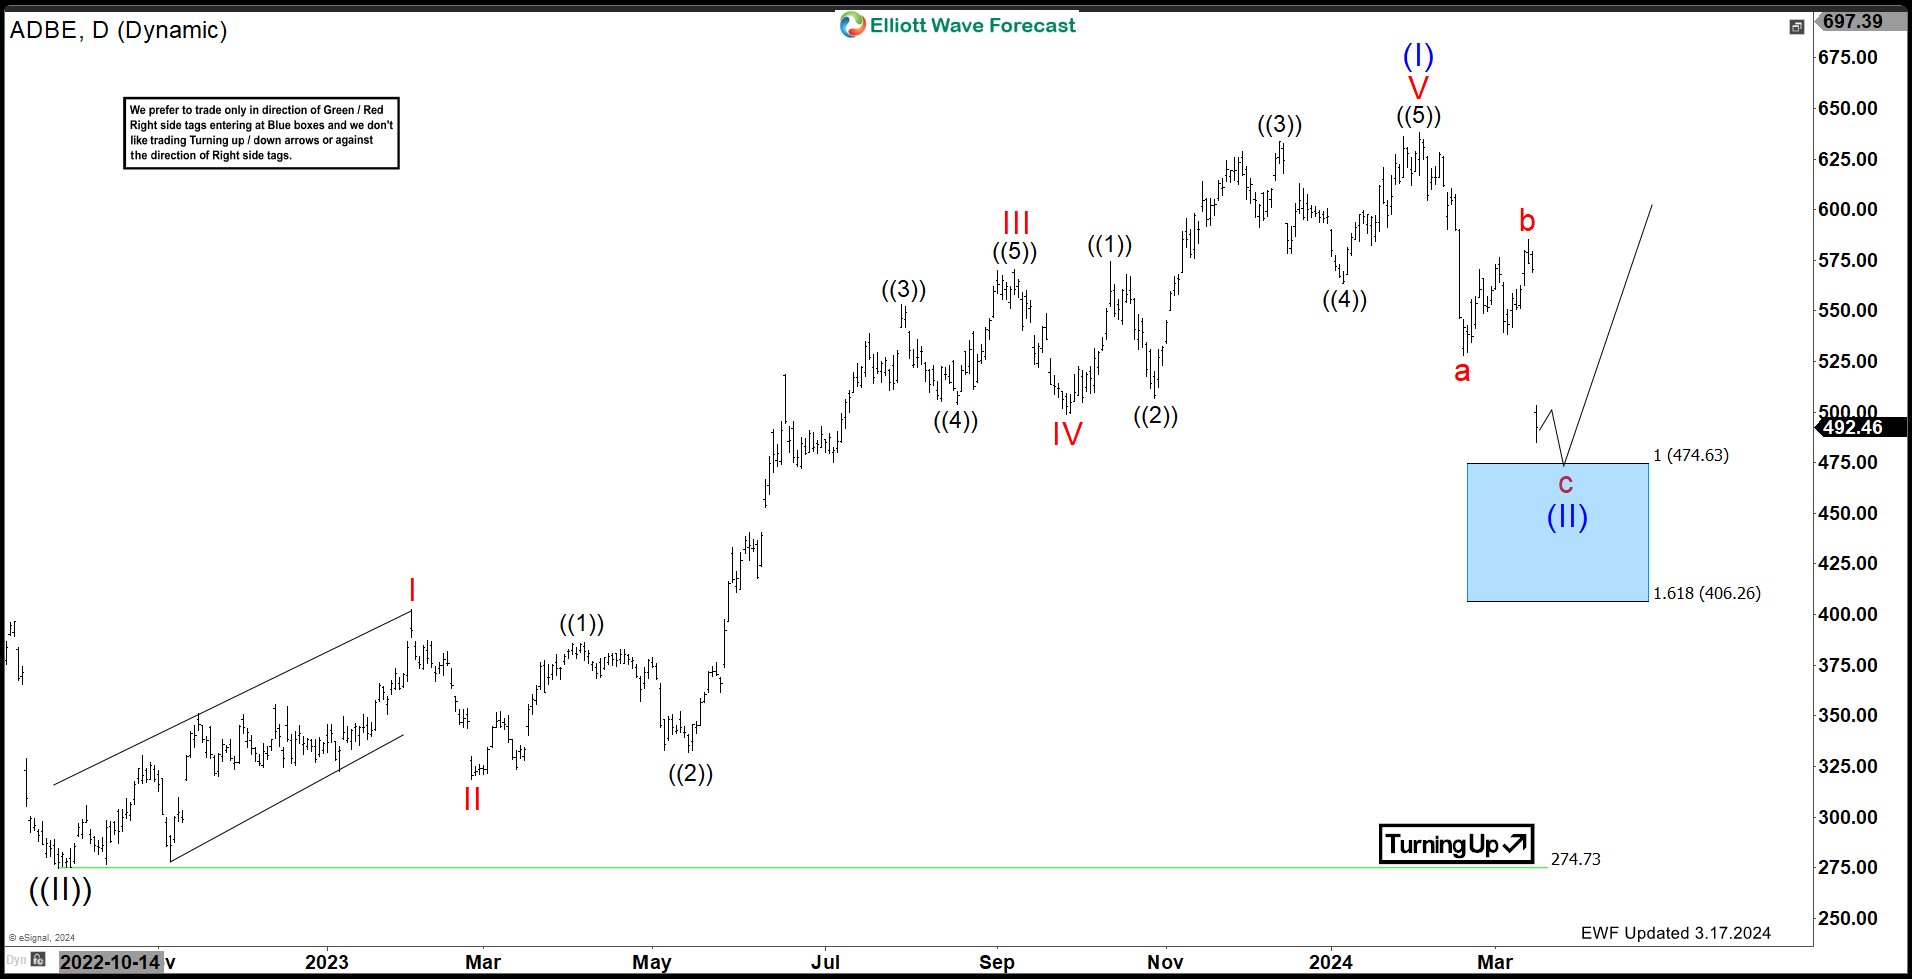
$ADBE Daily Elliott Wave View March 17th 2024:
The Daily chart above shows the cycle from Sep 2022 low unfold in a 5 waves impulse and end on 2.02.2024. The first pullback after a 5 waves impulse is in form of a 3 swings correction (ABC). The stock should be at the tail end of the correction towards the Blue Box area at $474.63 – 406.26 where buyers are expected to appear and start the next cycle higher. Although, we like it lower right now towards the blue box, traders should not be short selling the last swing lower as truncations can happen at this stage of the market.
As long as price remains above the invalidation level at $274.73, $ADBE is expected to rally soon. Remember, corrections run in 3, 7 or 11 swings, so risk management should be exercised. The market could bounce and end up doing 7 swings lower before higher so we like to book partial profits and get risk free once the bounce takes place from the blue box.
$ADBE Elliott Wave Video Analysis
Elliott Wave Forecast
We cover 78 instruments, but not every chart is a trading recommendation. We present Official Trading Recommendations in the Live Trading Room. If not a member yet, Sign Up for Free 14 days Trial now and get access to new trading opportunities.
Welcome to Elliott Wave Forecast!
Back


