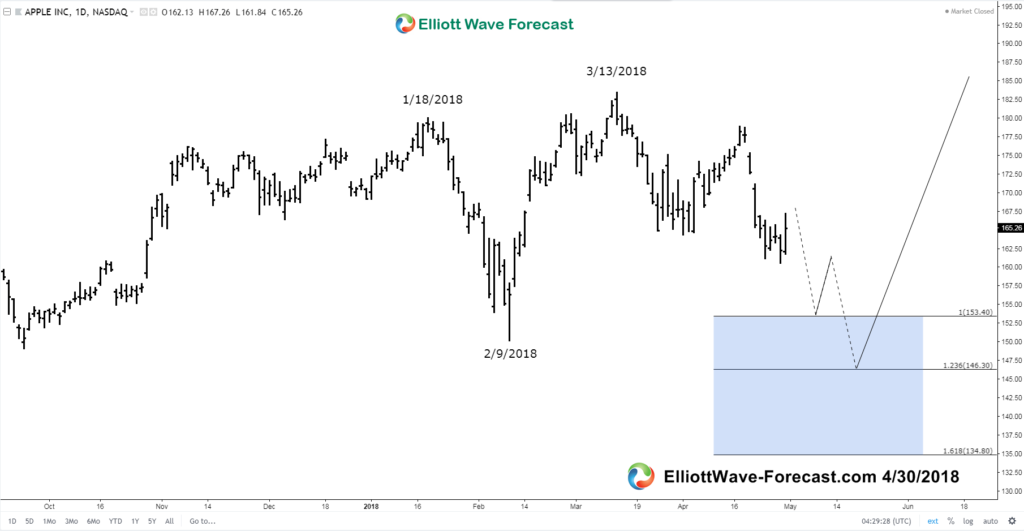
$AAPL Apple Expanded Flat from the 1/18/18 highs?
Is $AAPL Apple in an Expanded Flat from the 1/18/18 highs? Longer term on monthly and weekly charts it obviously appears that Apple remains in an uptrend. I will try to explain where the instrument can reach in the expanded flat from the 1/18/18 highs. I will also provide an alternate scenario that will offer a similar buy zone before the next leg higher. Apple’s stock made new highs in January however we think that was part of a larger correction.
With the possible expanded flat from the January 18 highs, the Elliott Wave structure would be 3-3-5. That means the leg lower from the 1/18/2018 highs to the 2/9/2018 lows was three swings and not an impulsive five waves. From the 2/9/2018 lows, the same can be said for the three swing bounce into the new highs on March 13th 2018. From those highs, this leaves the incomplete structure still needing the wave three of the impulse to complete along with a relatively shallow bounce in wave four followed with a final wave five low that would show momentum divergence compared to the wave three. The conclusion is below the chart.
$AAPL Apple Daily chart
In conclusion.
The target area for the the expanded flat is shown in the blue box on the chart and is derived from a Fibonacci extension measurement using a chart platform Fibonacci extension tool. With the beginning point being at the 1/18/2018 highs, go down to the 2/2/2018 lows as point #2. From there up to the 3/13/2018 highs being point #3. That will give the extension area shown on the chart as the potential buy zone.
As mentioned in the first paragraph an alternative structure and target area will be a simple three swings lower from the 3/13/2018 highs. That would be a double three correction which counts as 3-3-3. This target area is not shown on the chart but I will tell you how to get it. Using the charting platform Fibonacci extension tool in the same manner as before. Begin at the 3/13/2018 highs as point #1 on down to the April 2nd lows as point #2. From there point #3 will be at the April 17th highs. That gives an extension area for a double three correction at the 159.66-147.74 area.
Thanks for looking at our website. Check out our services Free for 14 days and see if we can be of help. Kind regards & good luck trading.
Lewis Jones of the ElliottWave-Forecast.com Team


