Pan American Silver (PAAS) is a leading mining company headquartered in Vancouver, Canada. It specializes in the exploration, development, and operation of silver mines across the Americas. The company has a diversified portfolio spanning Mexico, Peru, Argentina, and Bolivia. Below we will look at the Elliott Wave outlook for the company.
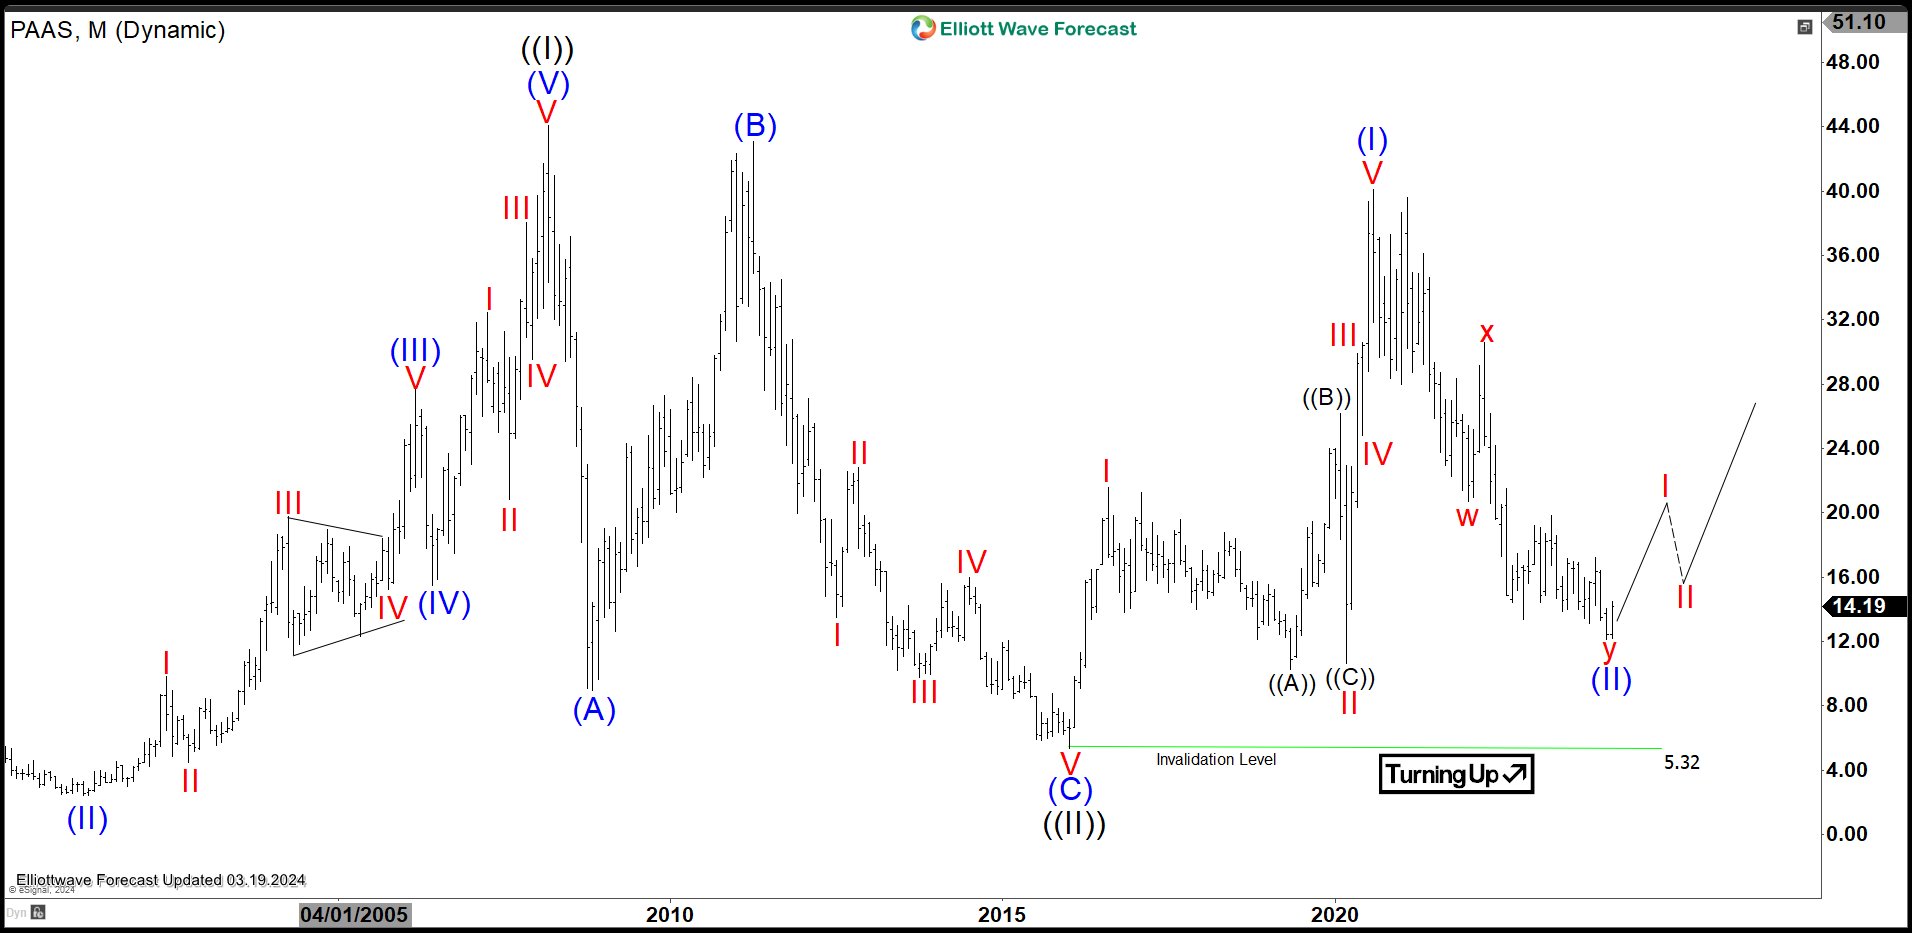
PAAS Monthly Elliott Wave Chart
Monthly Elliott Wave of Pan American Silver (PAAS) shows that the stock ended wave ((II)) at 5.32 on January 2016 low. Up from there, it has started a new bullish cycle. Wave (I) ended at 40.11 and wave (II) pullback may have ended already at 12.16. Expect the stock to resume higher as far as it stays above 5.32.
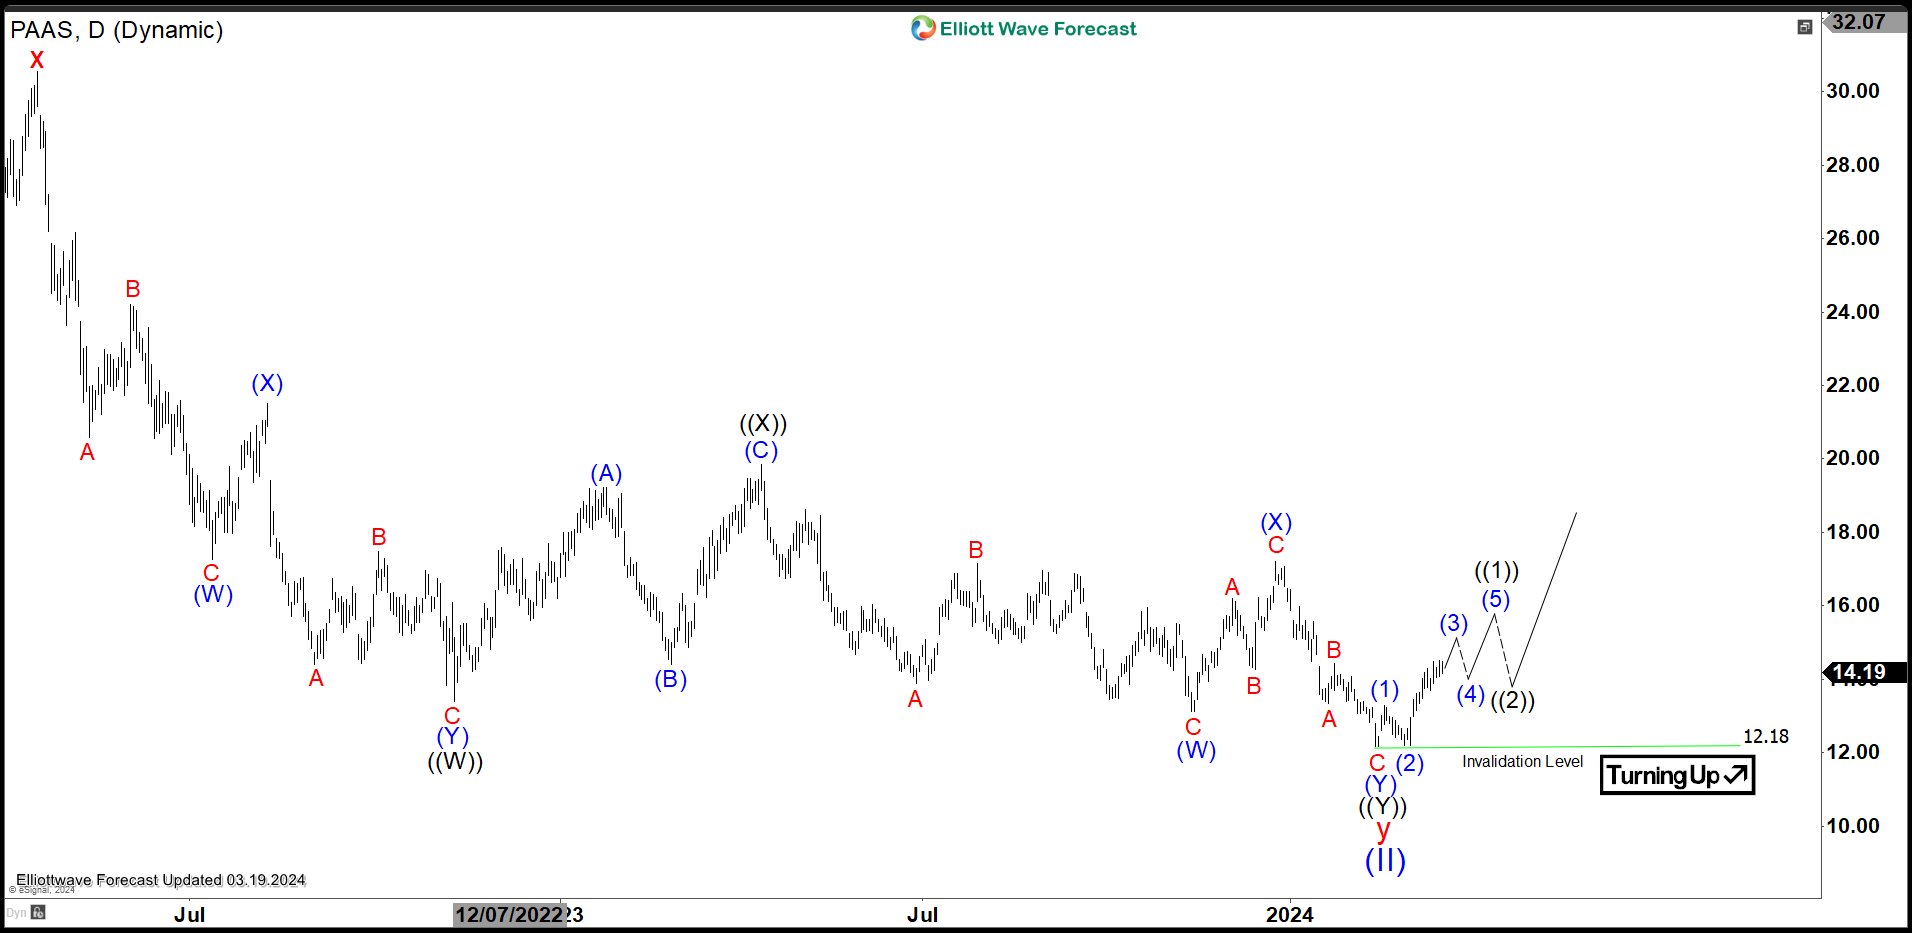
PAAS Daily Elliott Wave Chart
Daily Elliott Wave Chart of Pan American Silver (PAAS) shows that the stock may have ended wave (II) at 12.18. Further rally and separation from the low is desirable to give confirmation that the low is really in place. Up from wave (II), the rally looks impulsive with wave (1) ended at 13.28 and wave (2) ended at 12.2. Wave (3) is now in progress before a pullback in wave (4) and then higher again in wave (5) to complete wave ((1)). Near term, as far as pivot at 12.18 low stays intact, expect the stock to extend higher.
To get regular technical updates on 72 instrument from stocks, Indices, forex, and commodities, feel free to try our service free –> 14 days FREE Trial.


